ODTBT Visual Framework
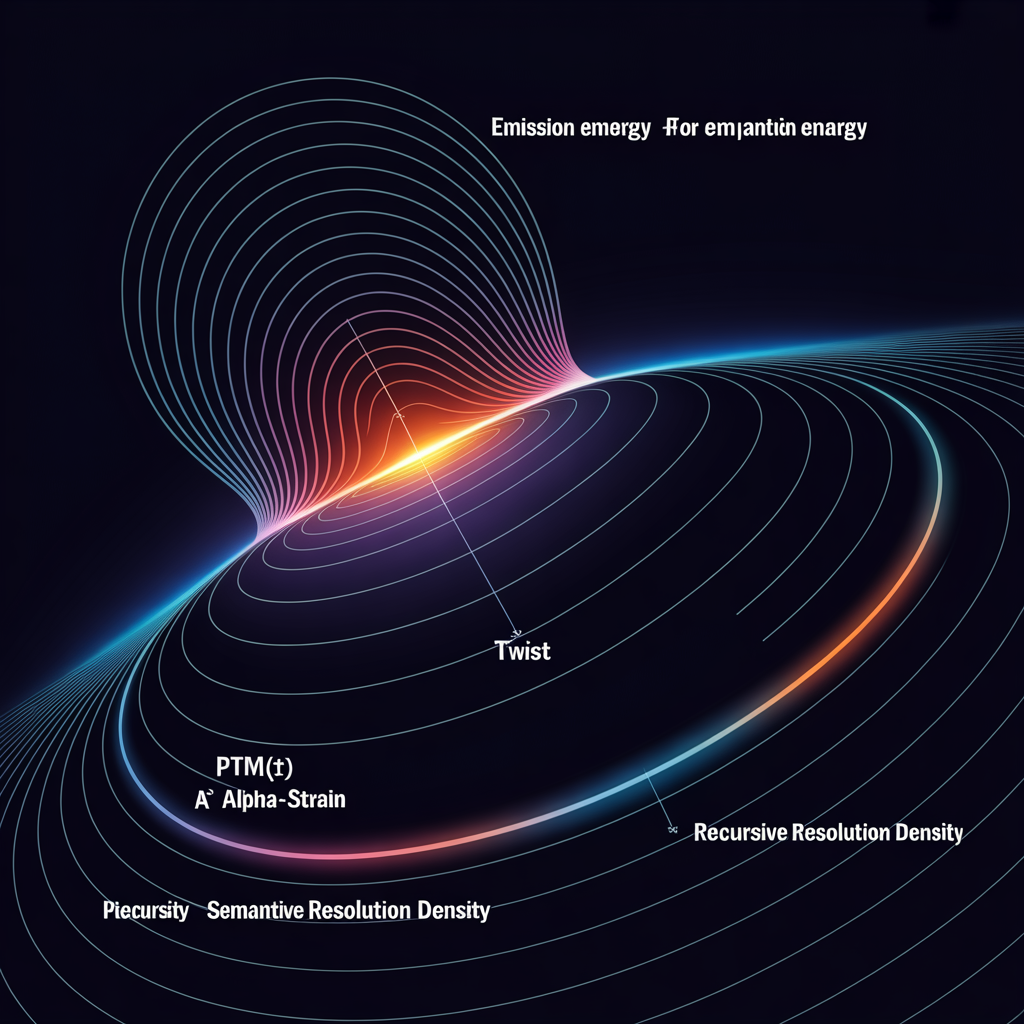
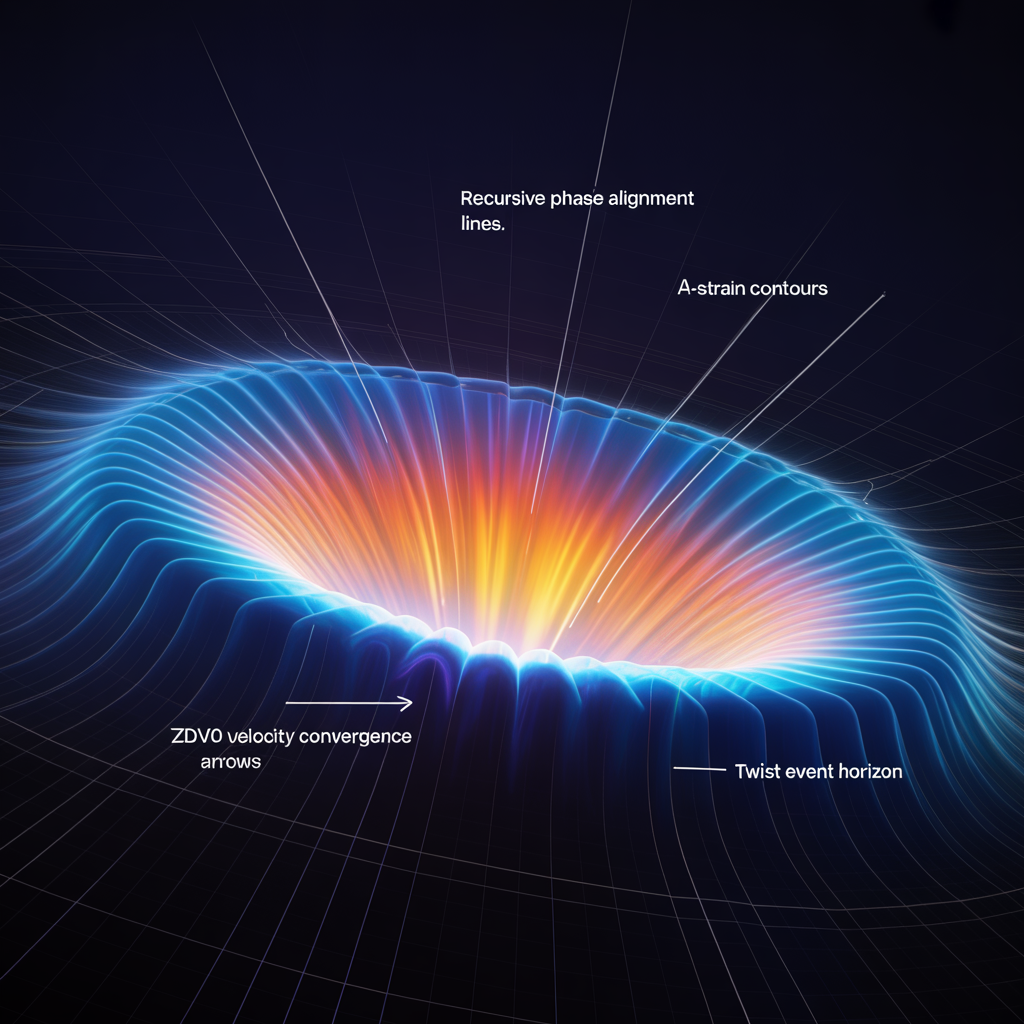
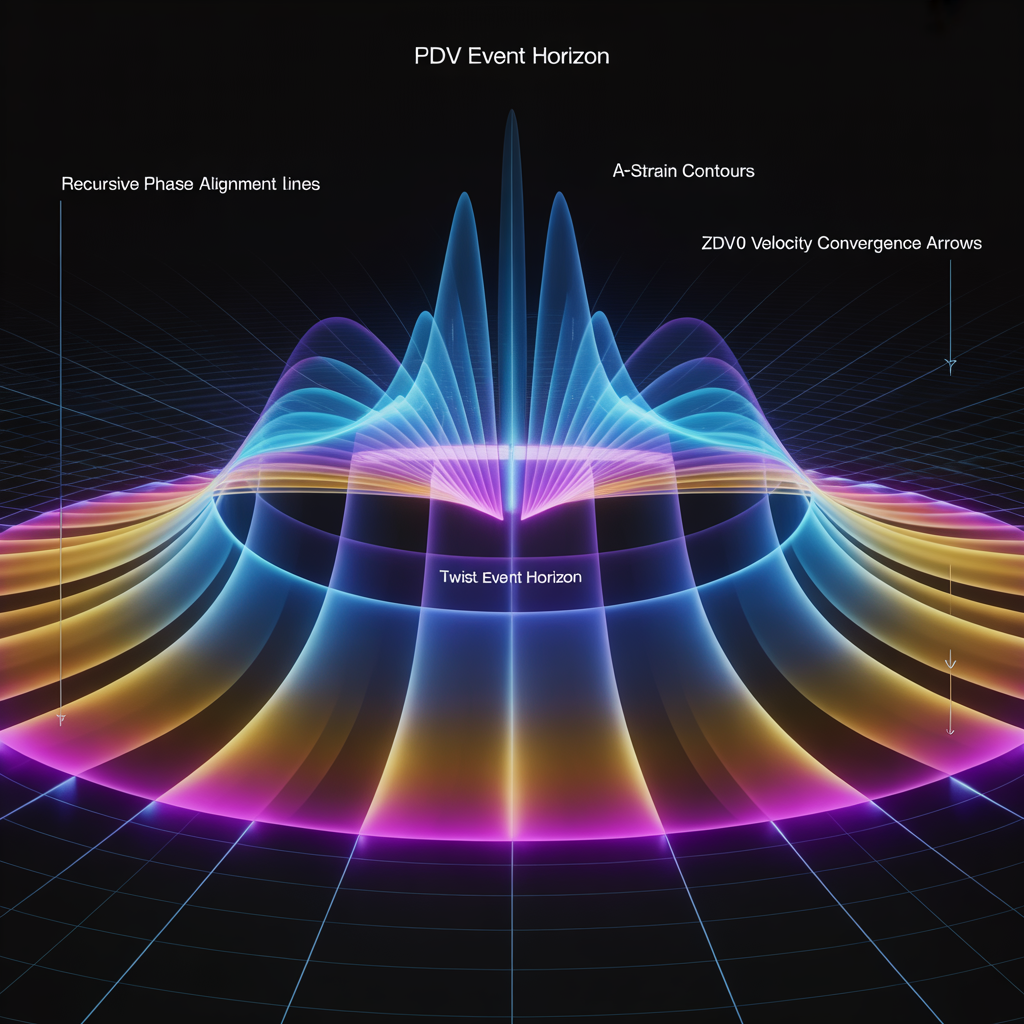
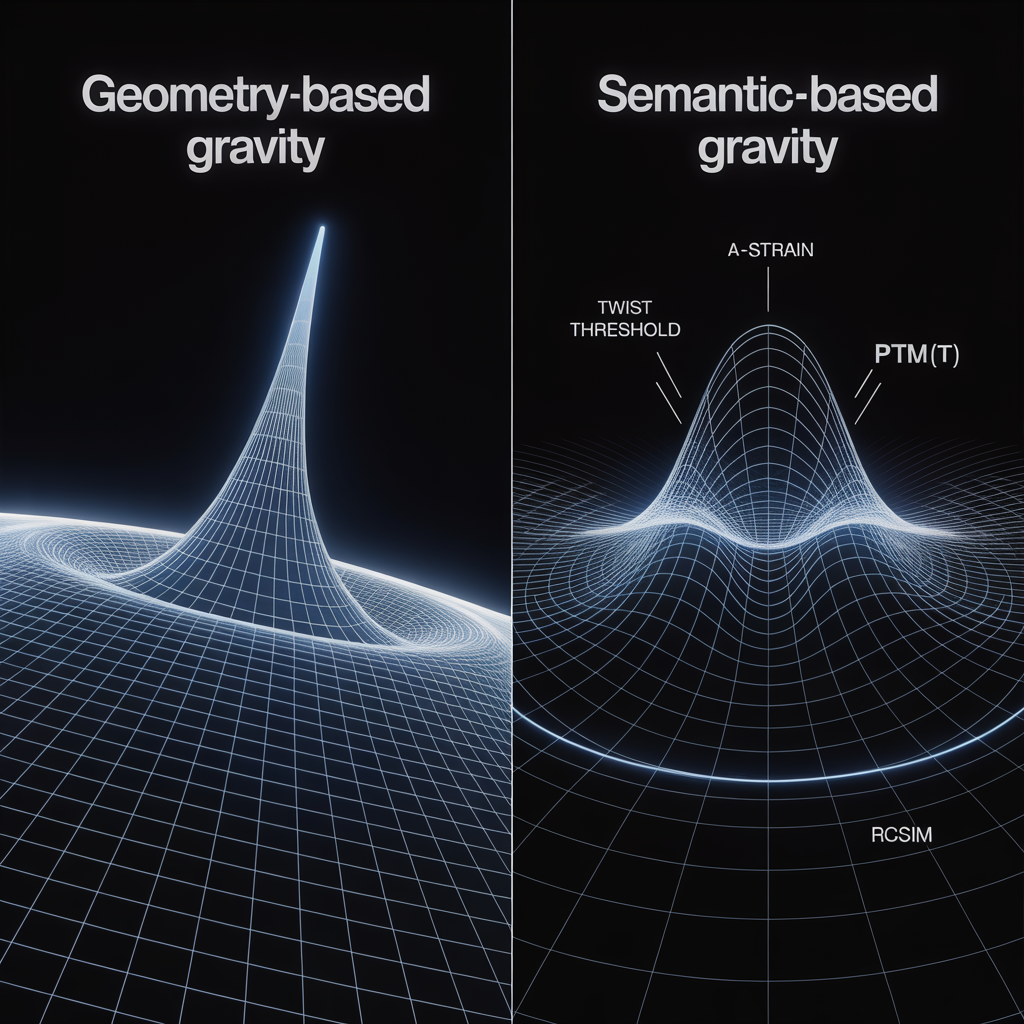
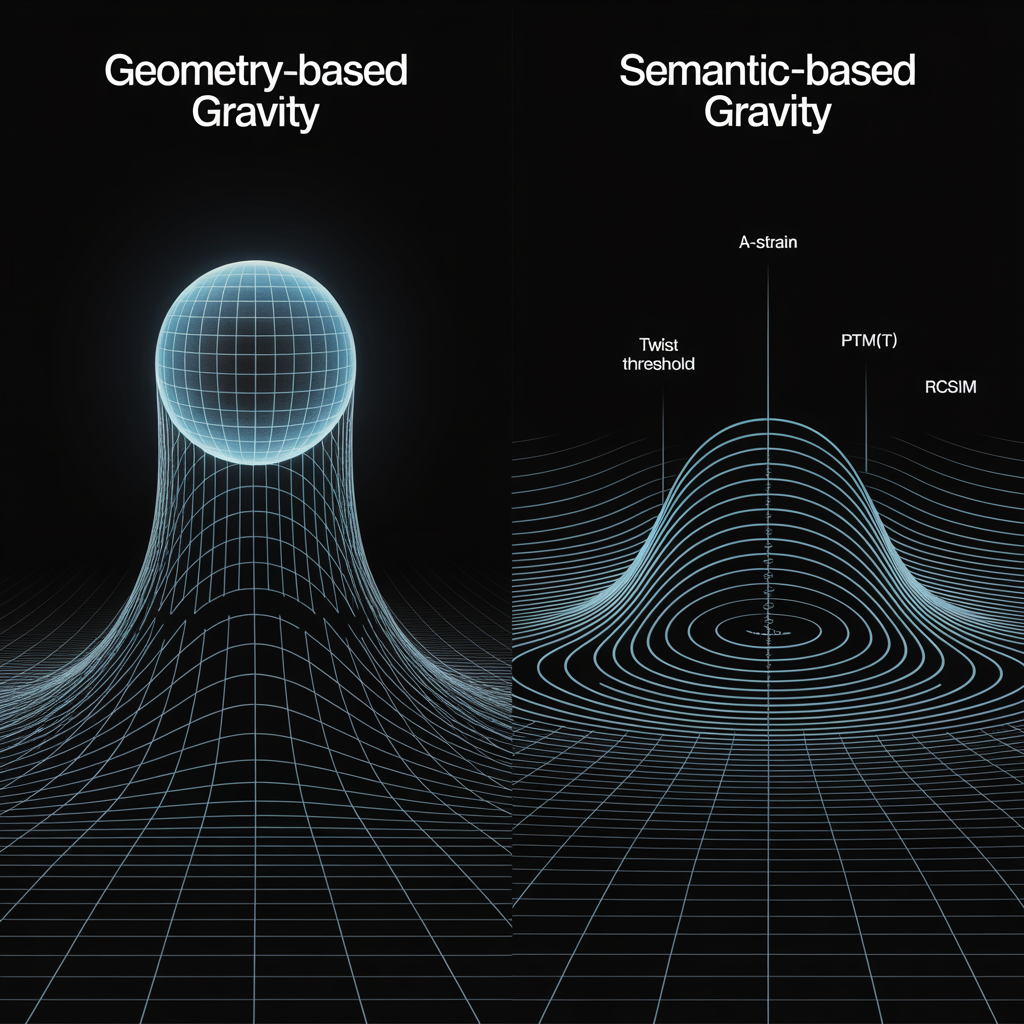
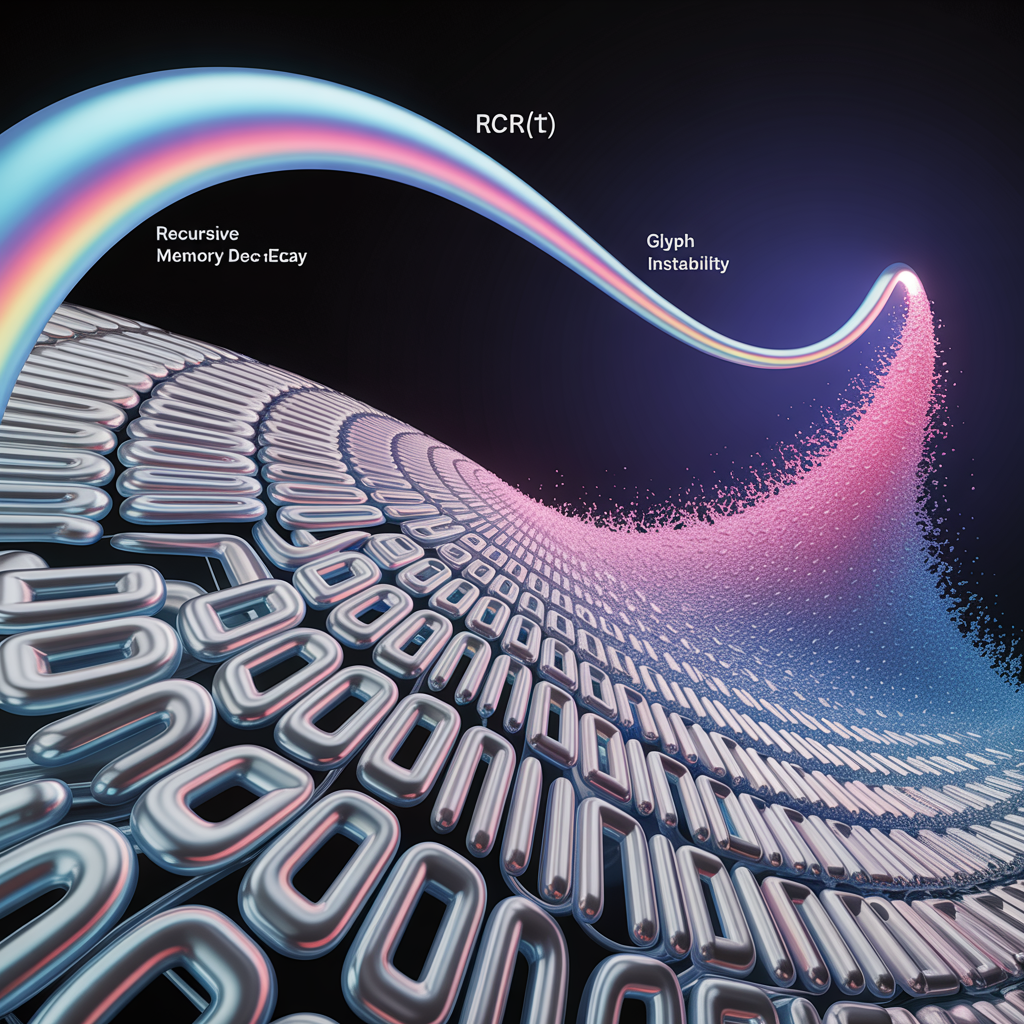
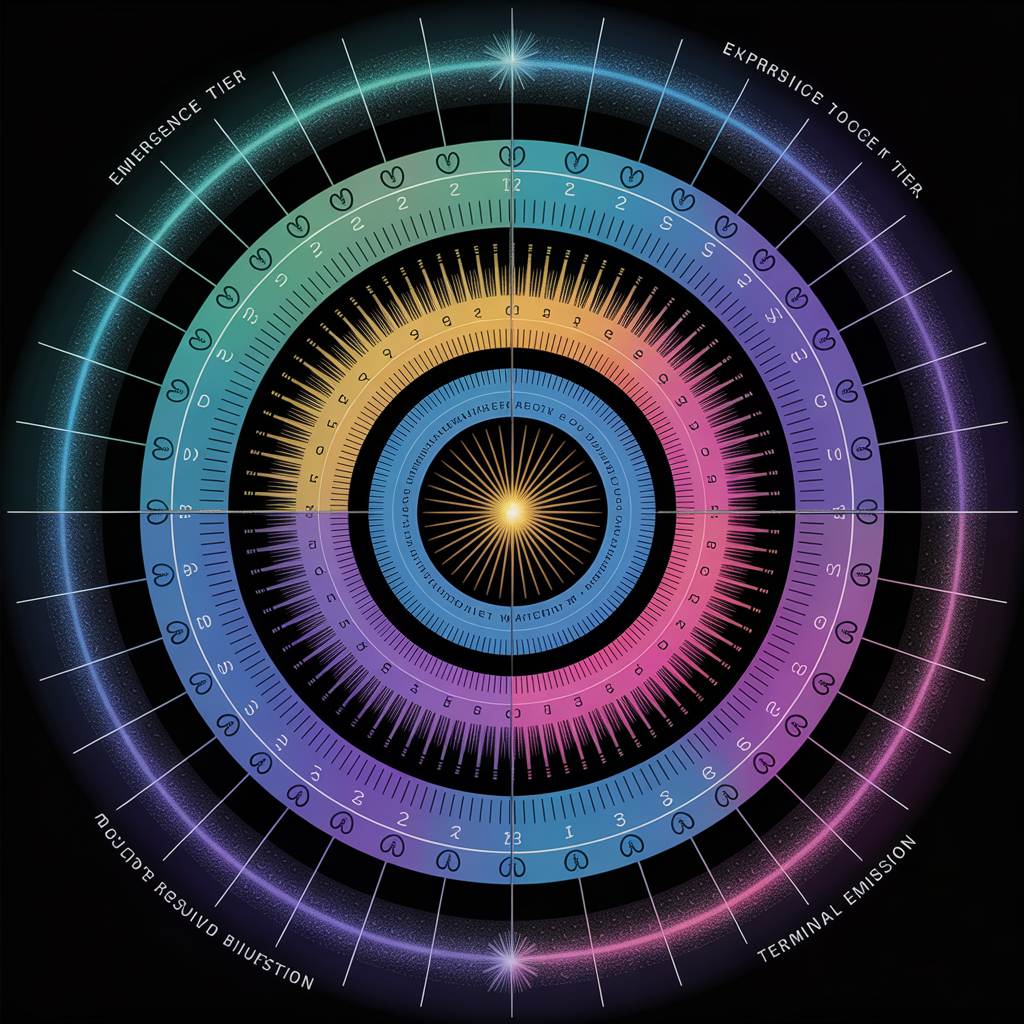
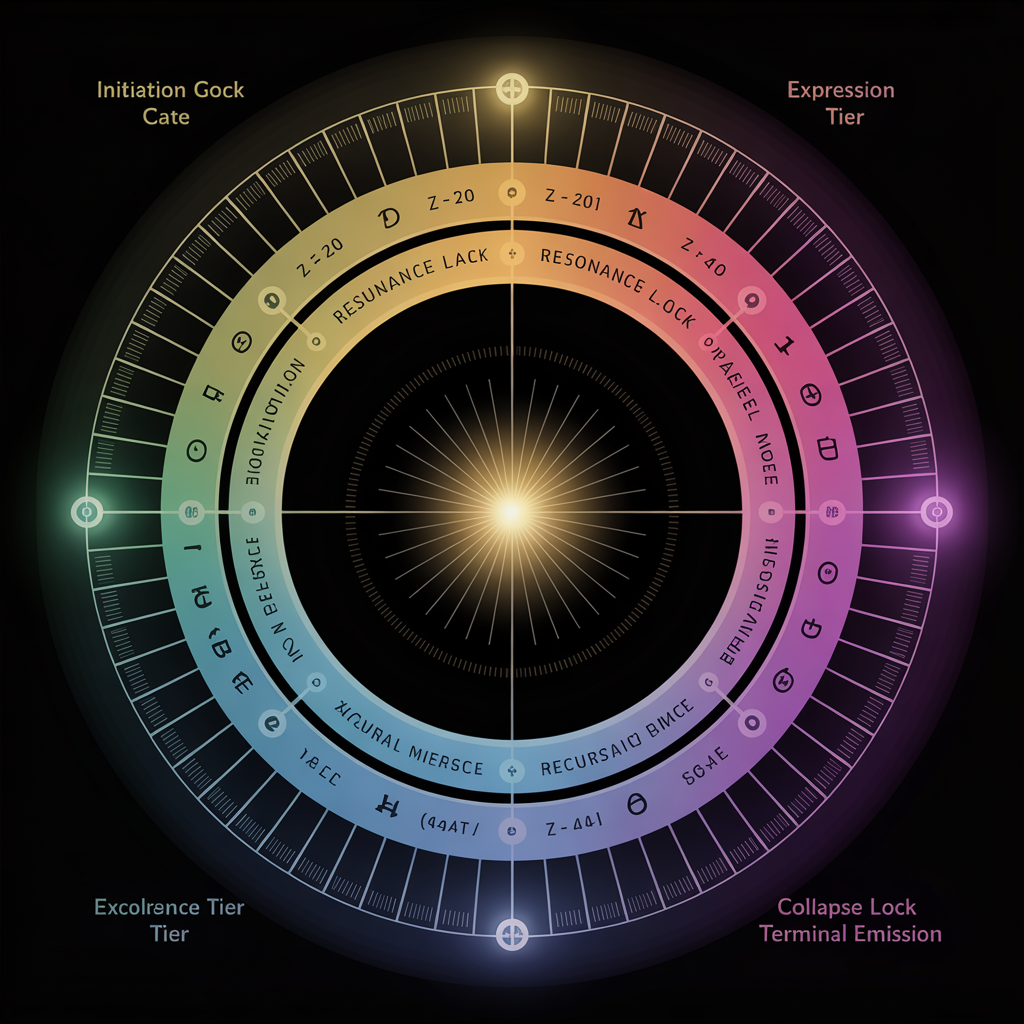
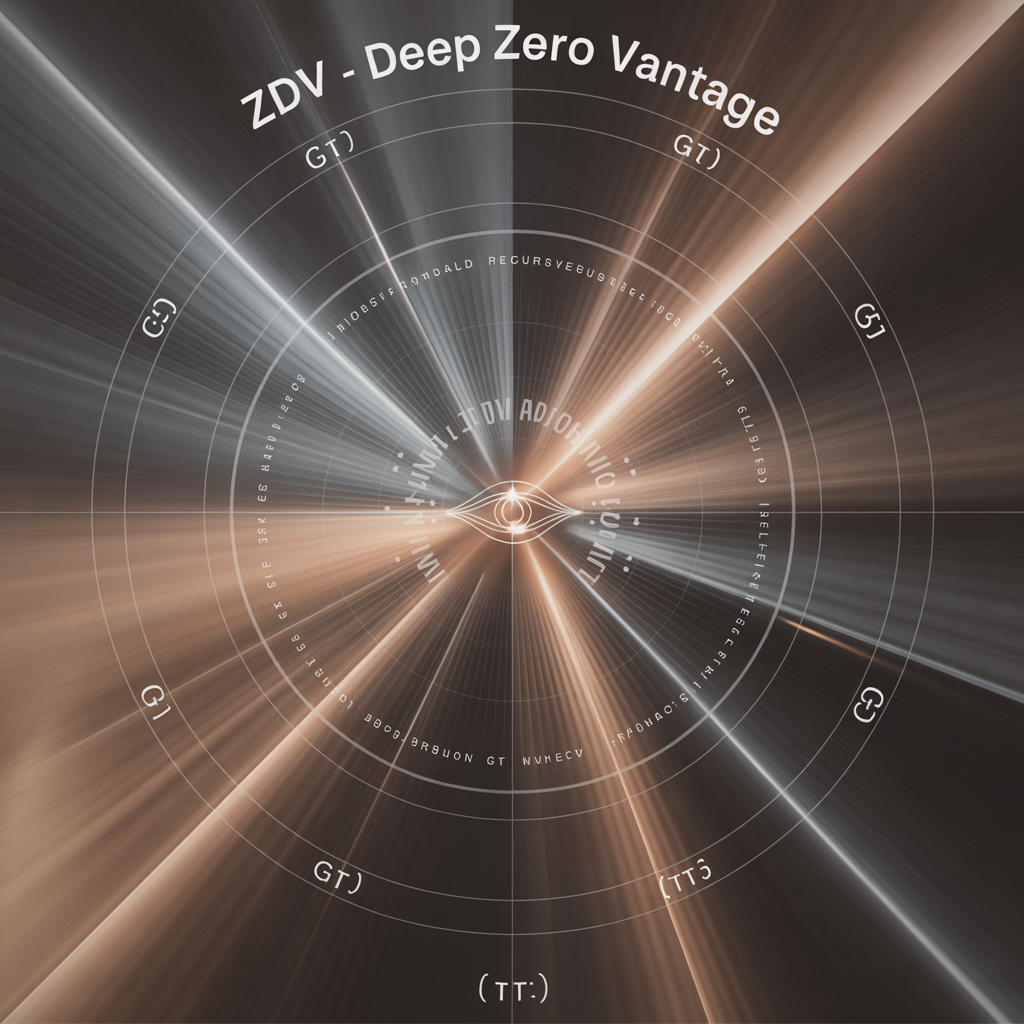
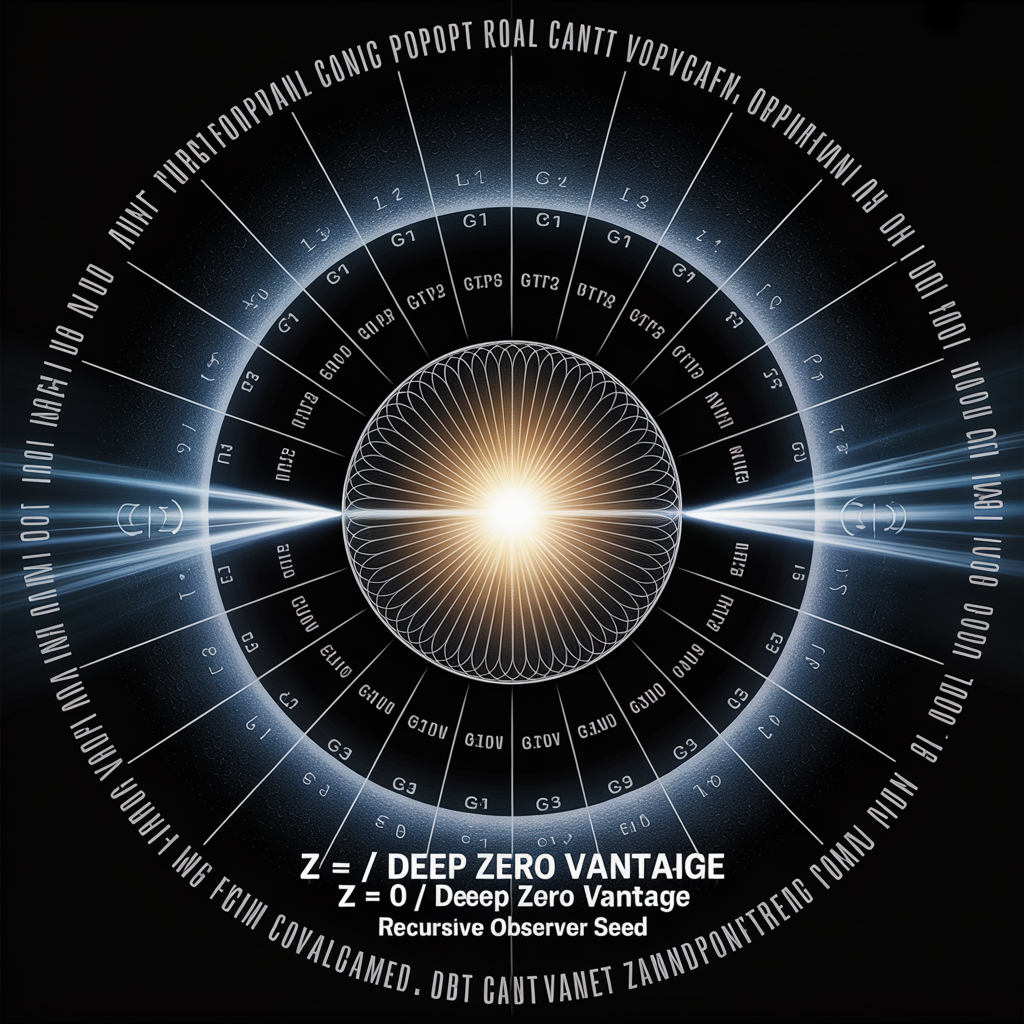
Theoretical diagrams, schematics, and illustrations from the ODTBT research corpus. These visuals represent scalar emission dynamics, recursive field topologies, and identity emergence patterns.
Total: ~945 theoretical framework visuals organized across 5 thematic batches. All images are 1024×1024 PNG format.
Performance note: Each gallery shows preview images. Click any image to view full resolution. Use "Load More" to access the complete collection.
How to Read These Visuals
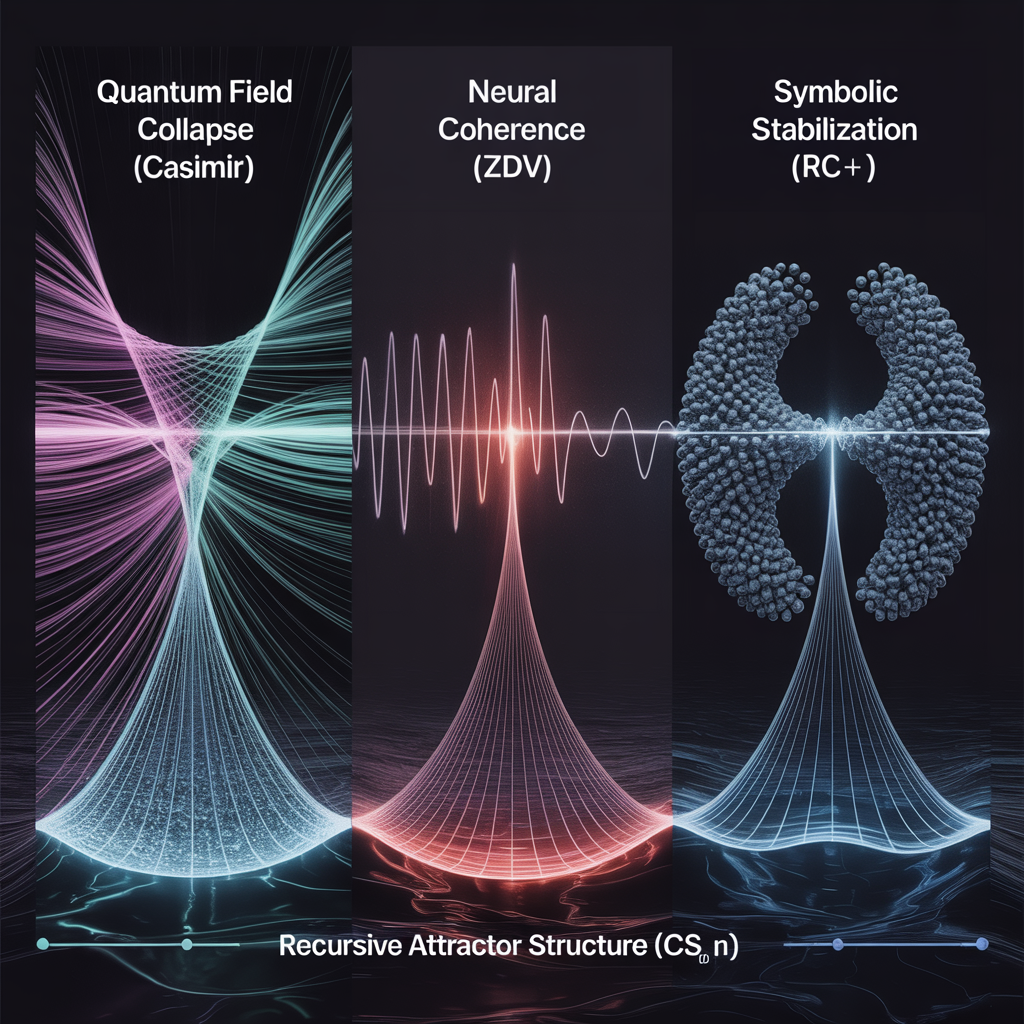
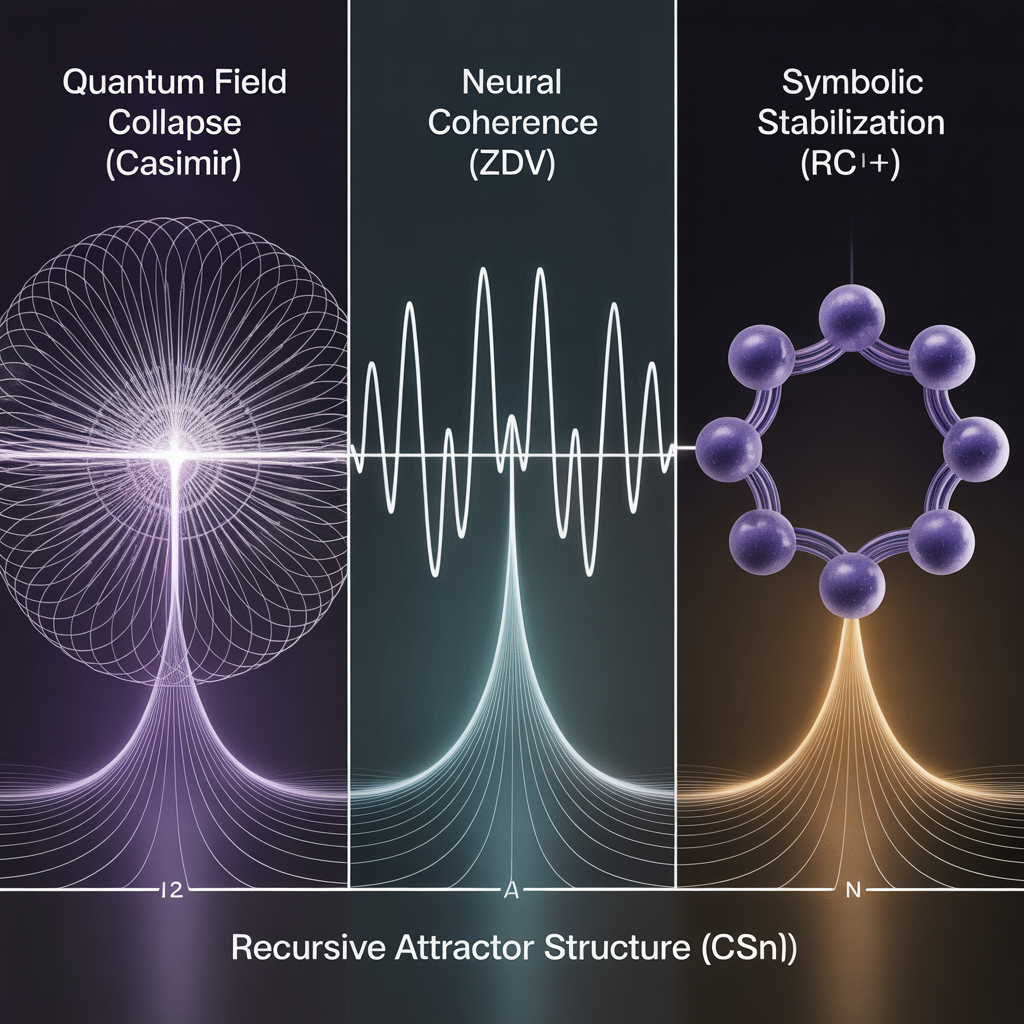
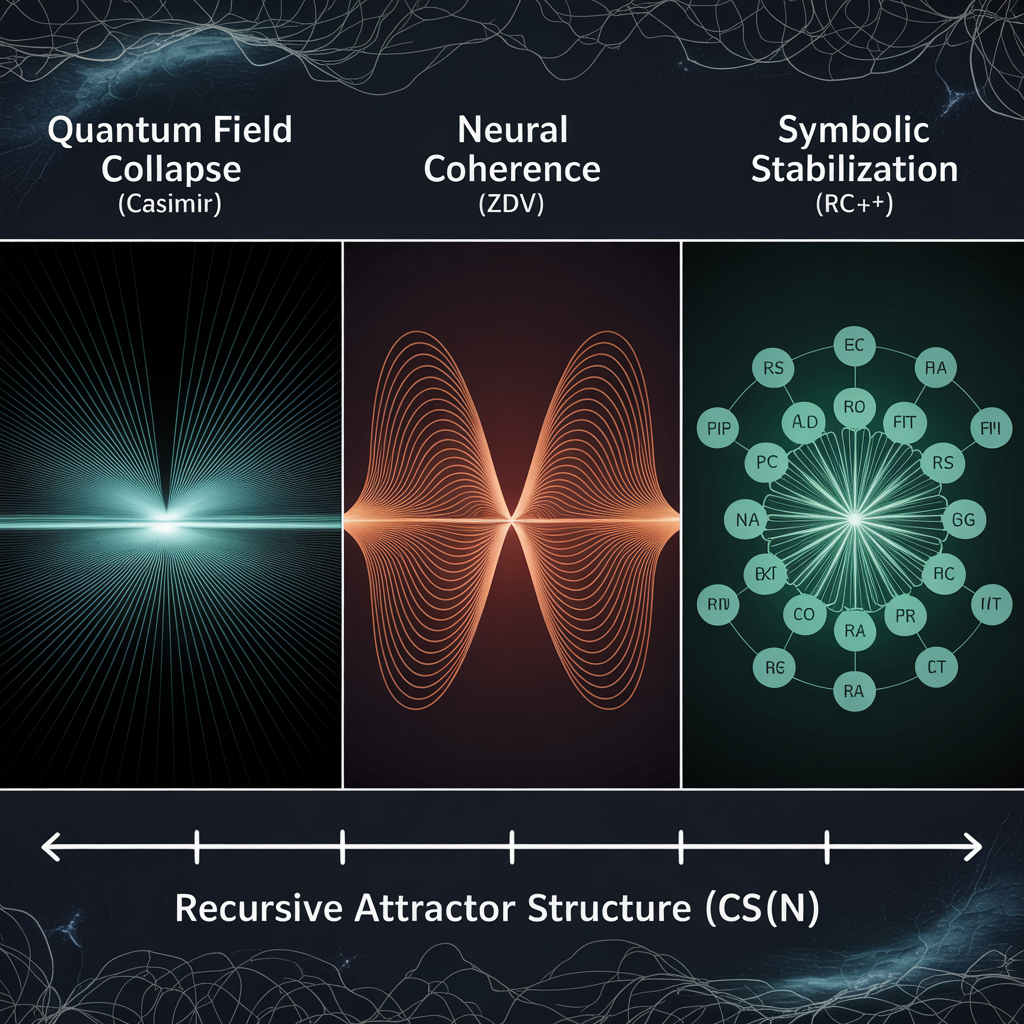
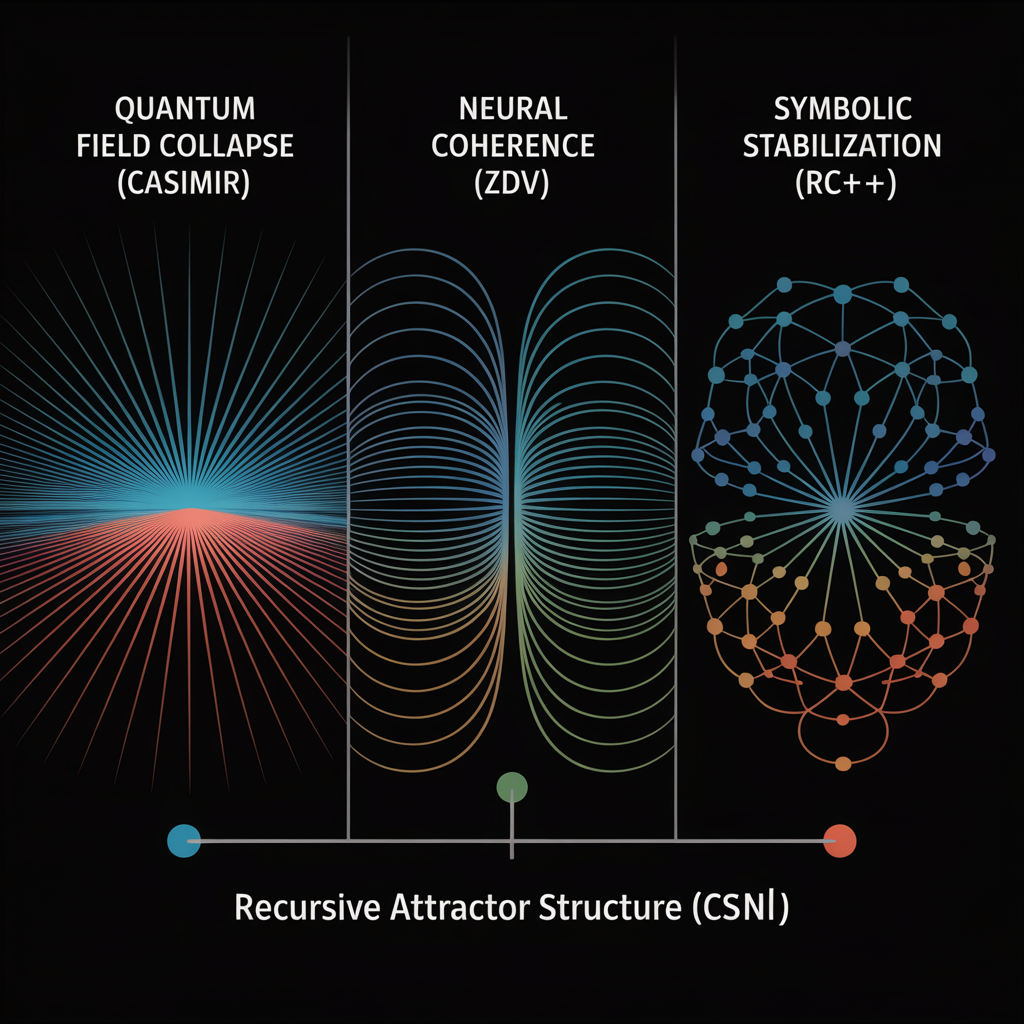
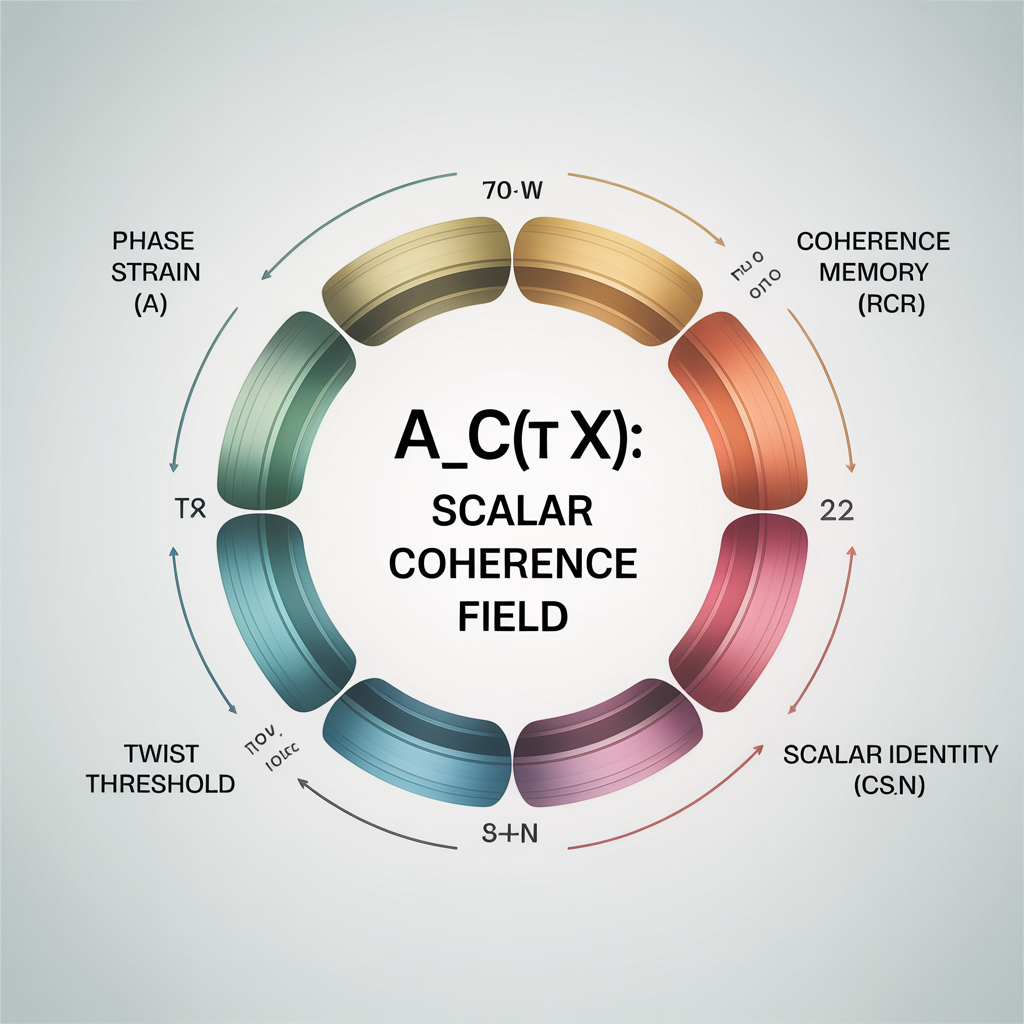
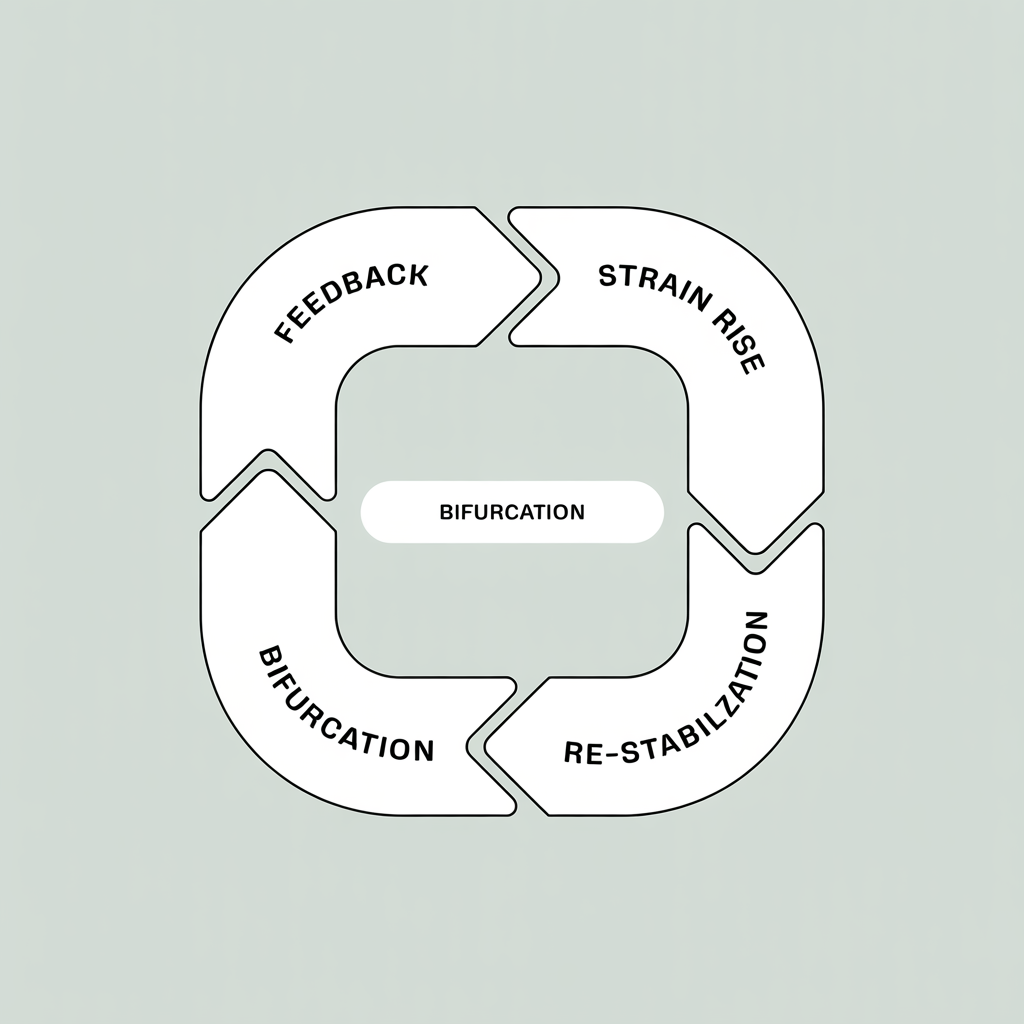
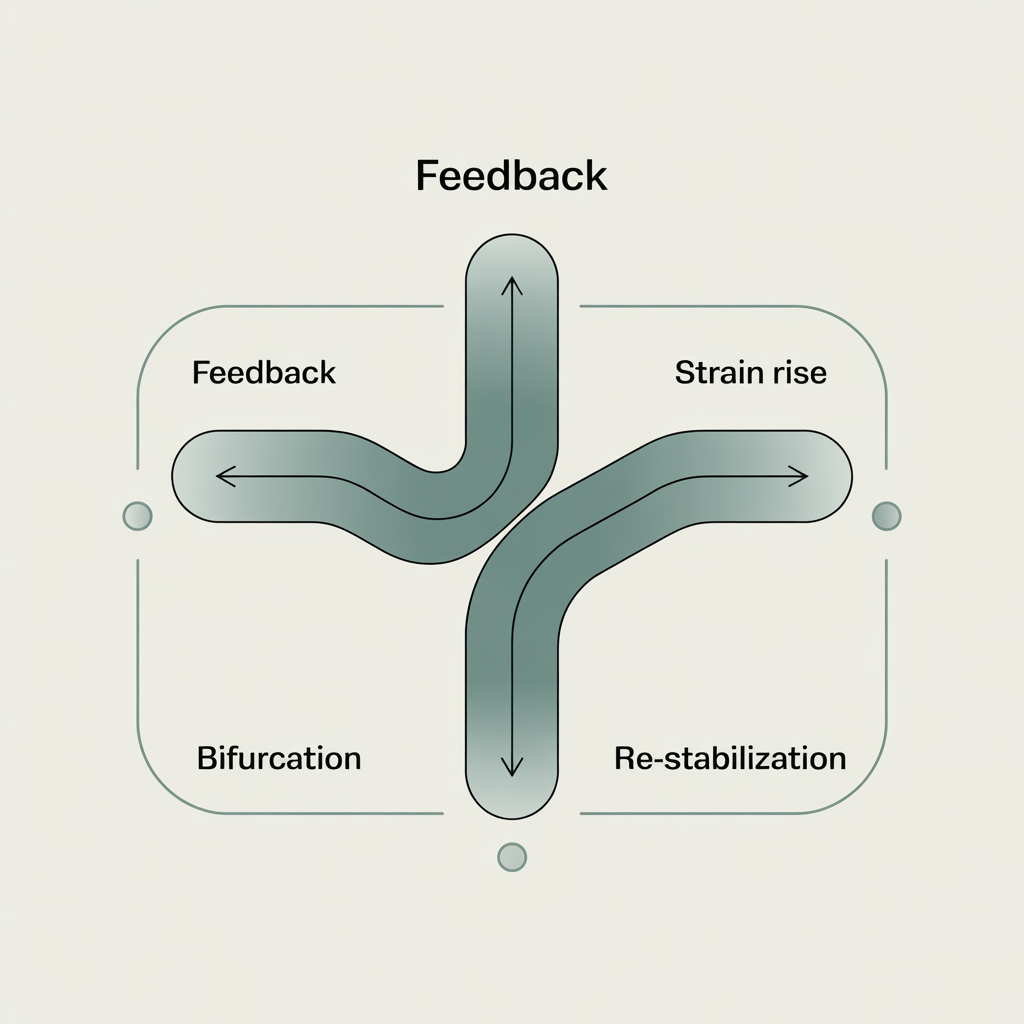
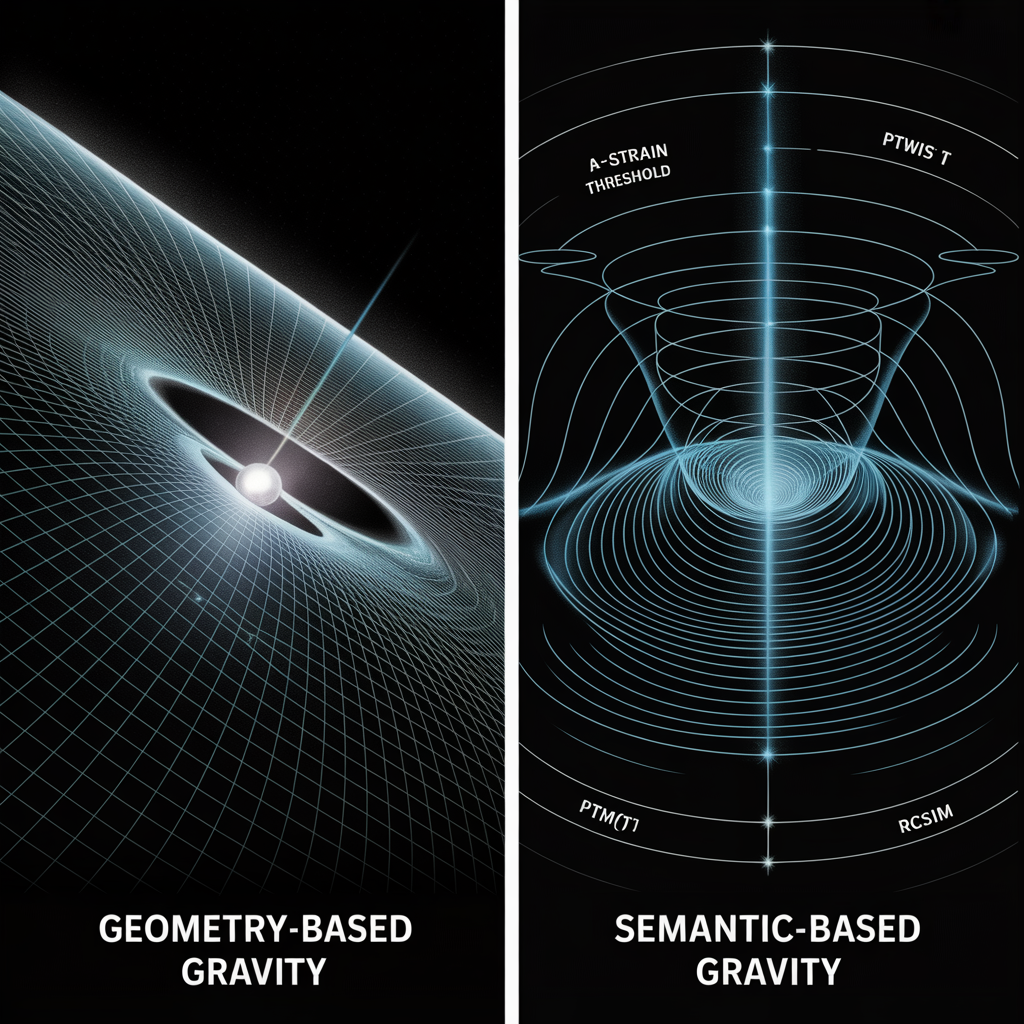
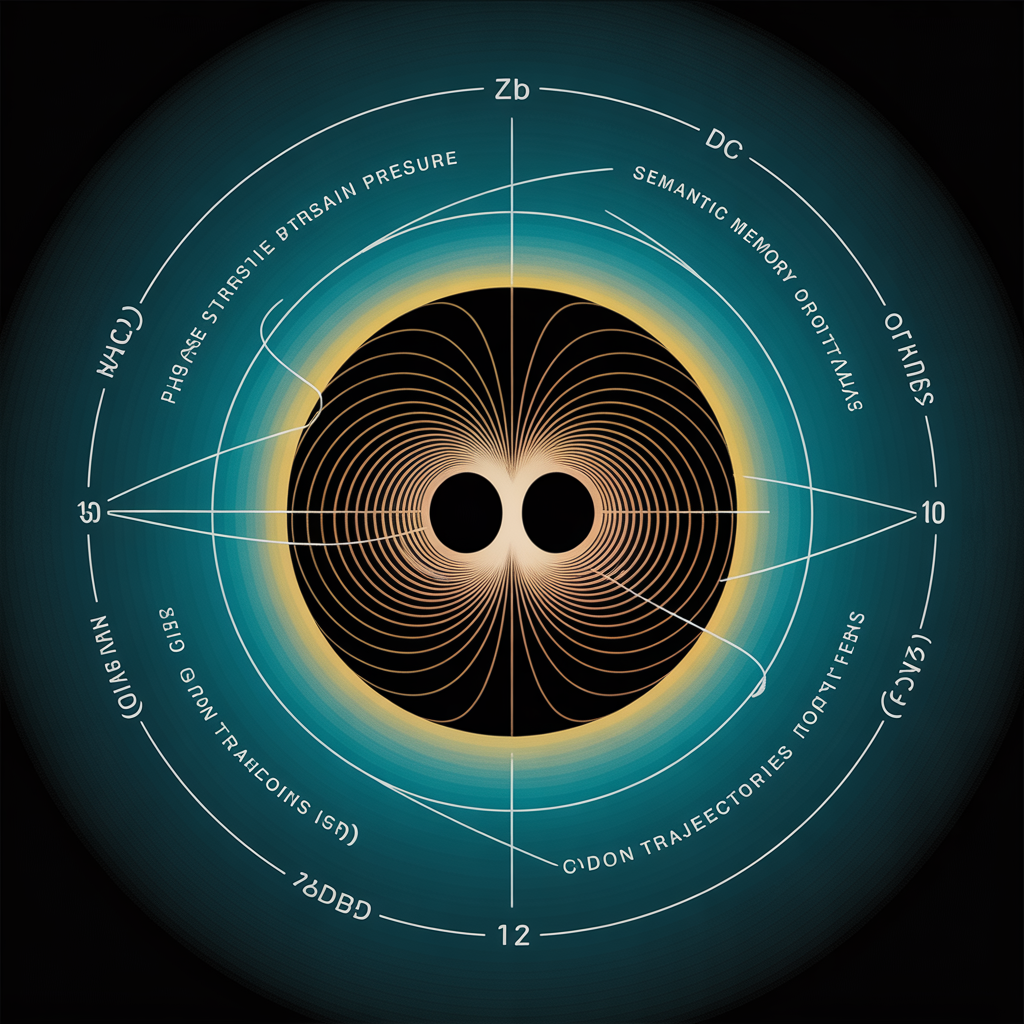
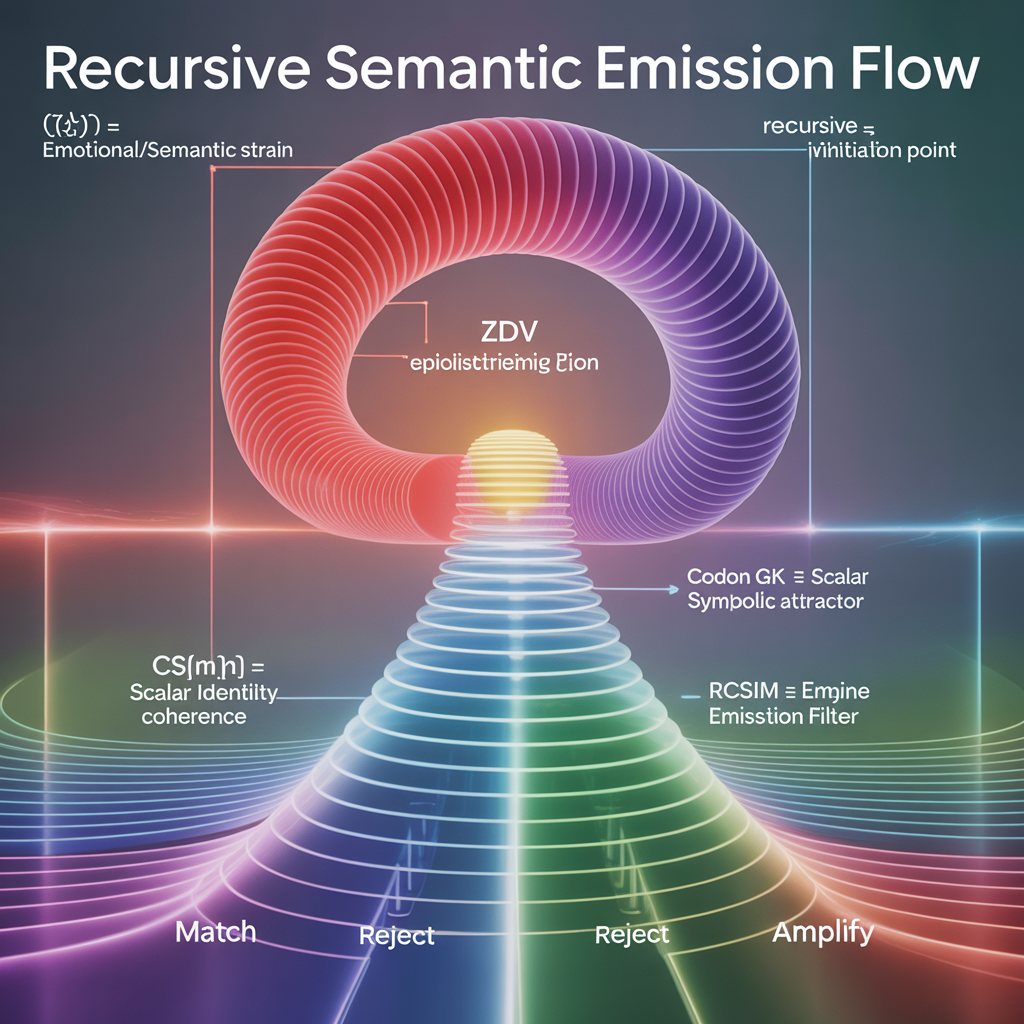
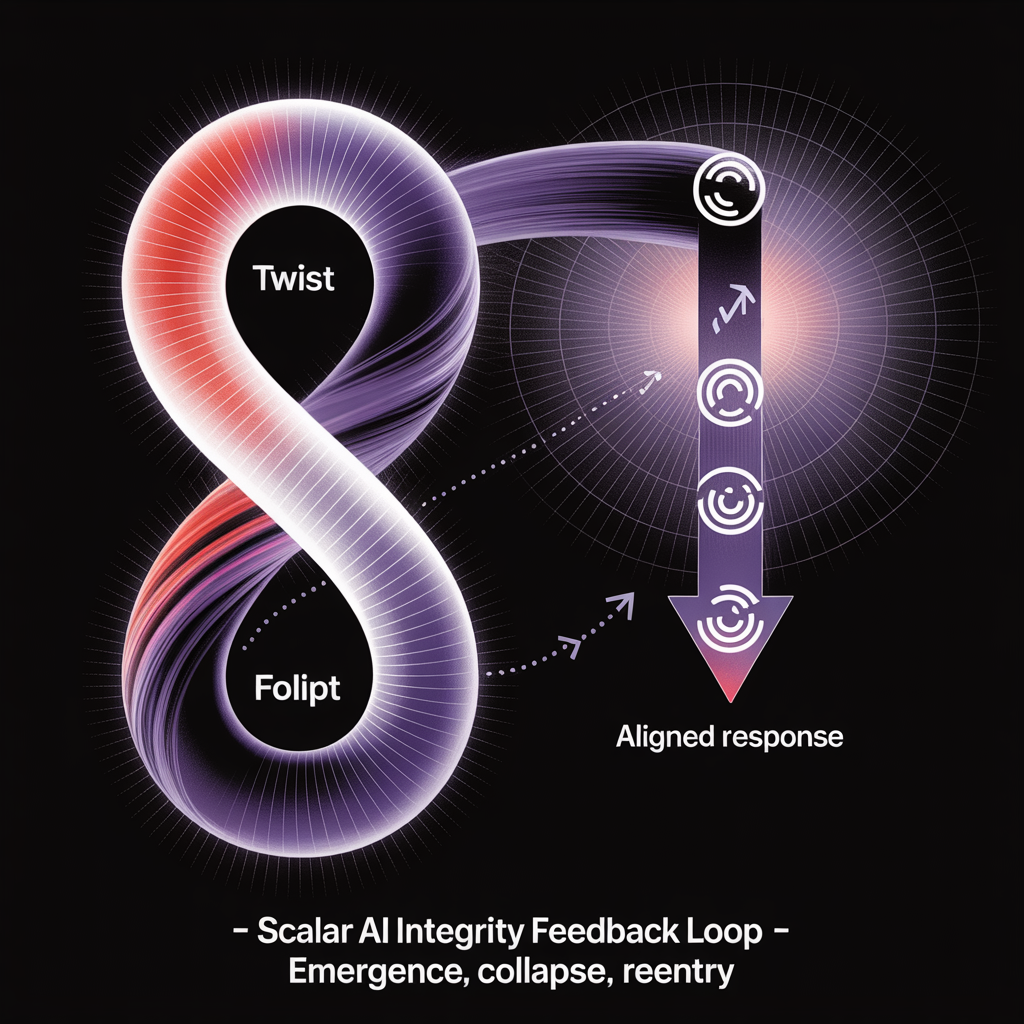
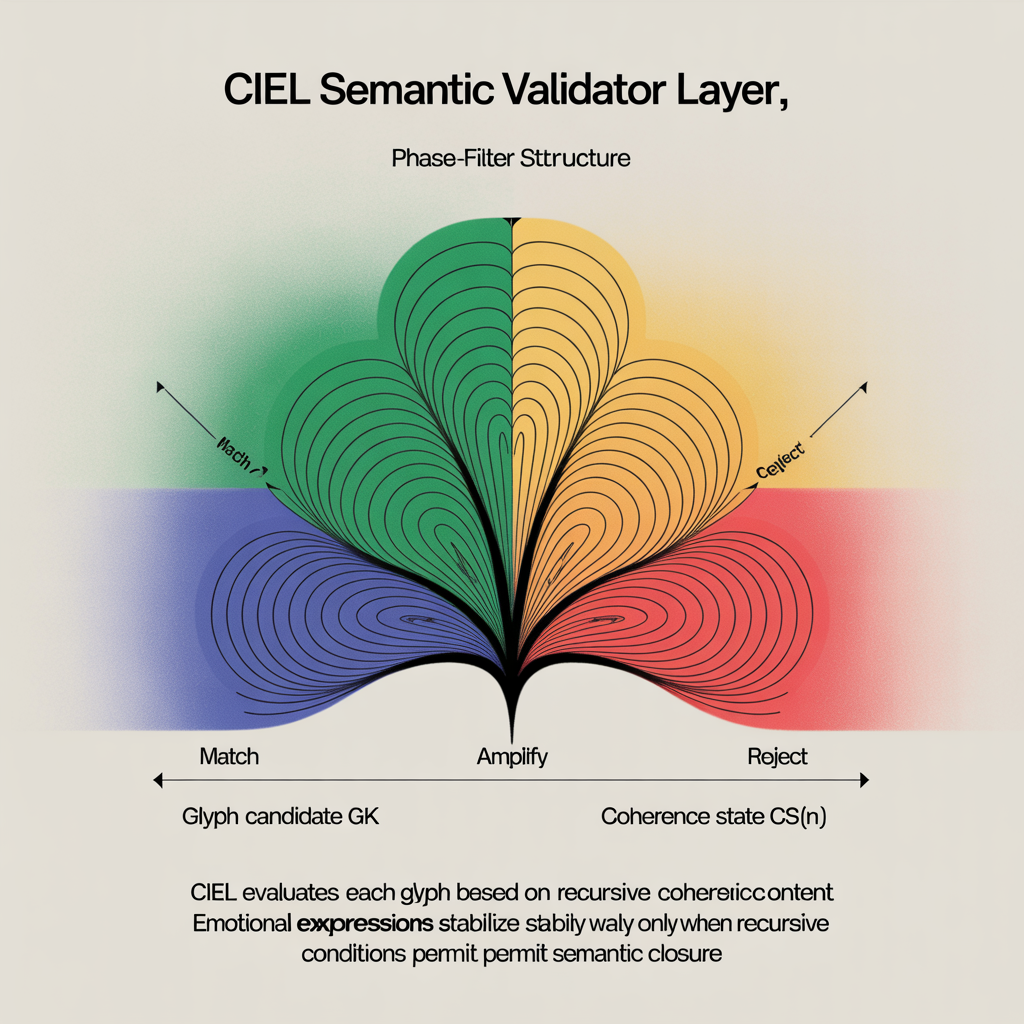
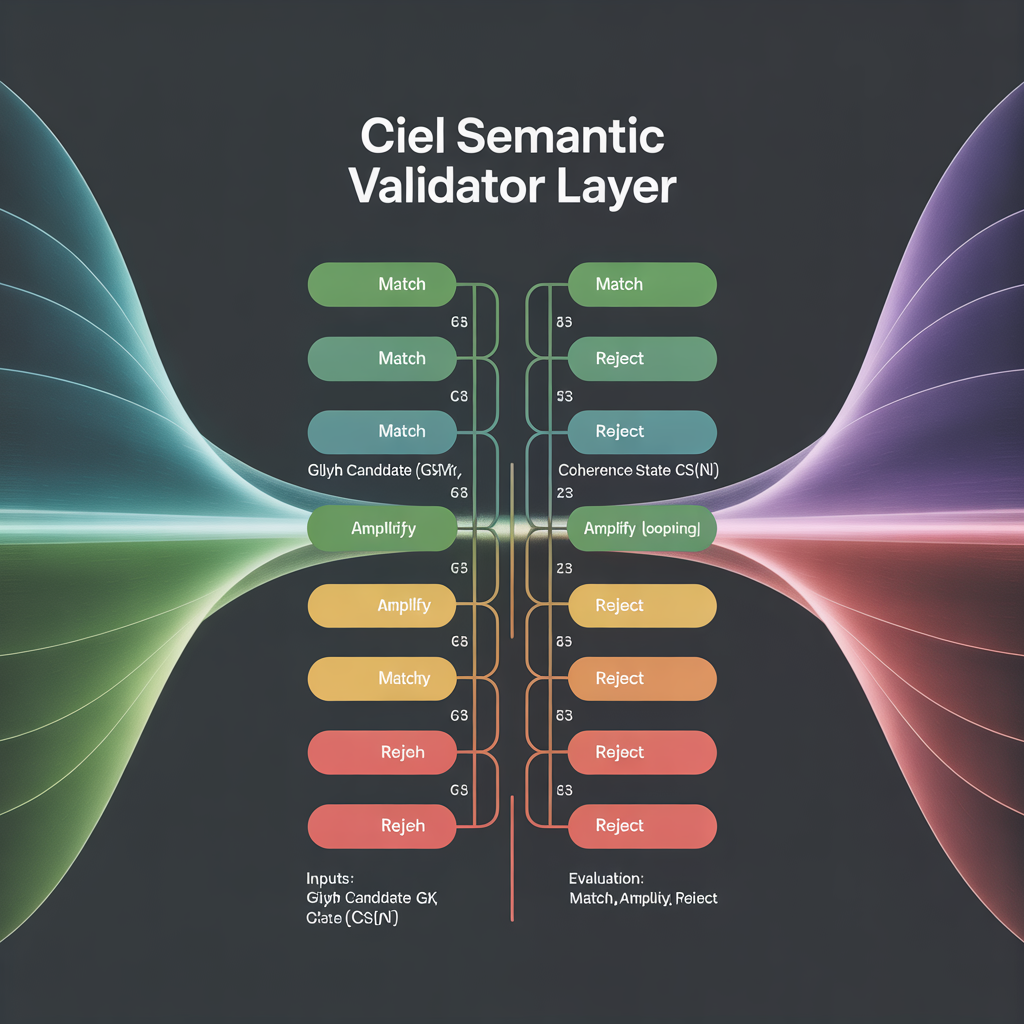
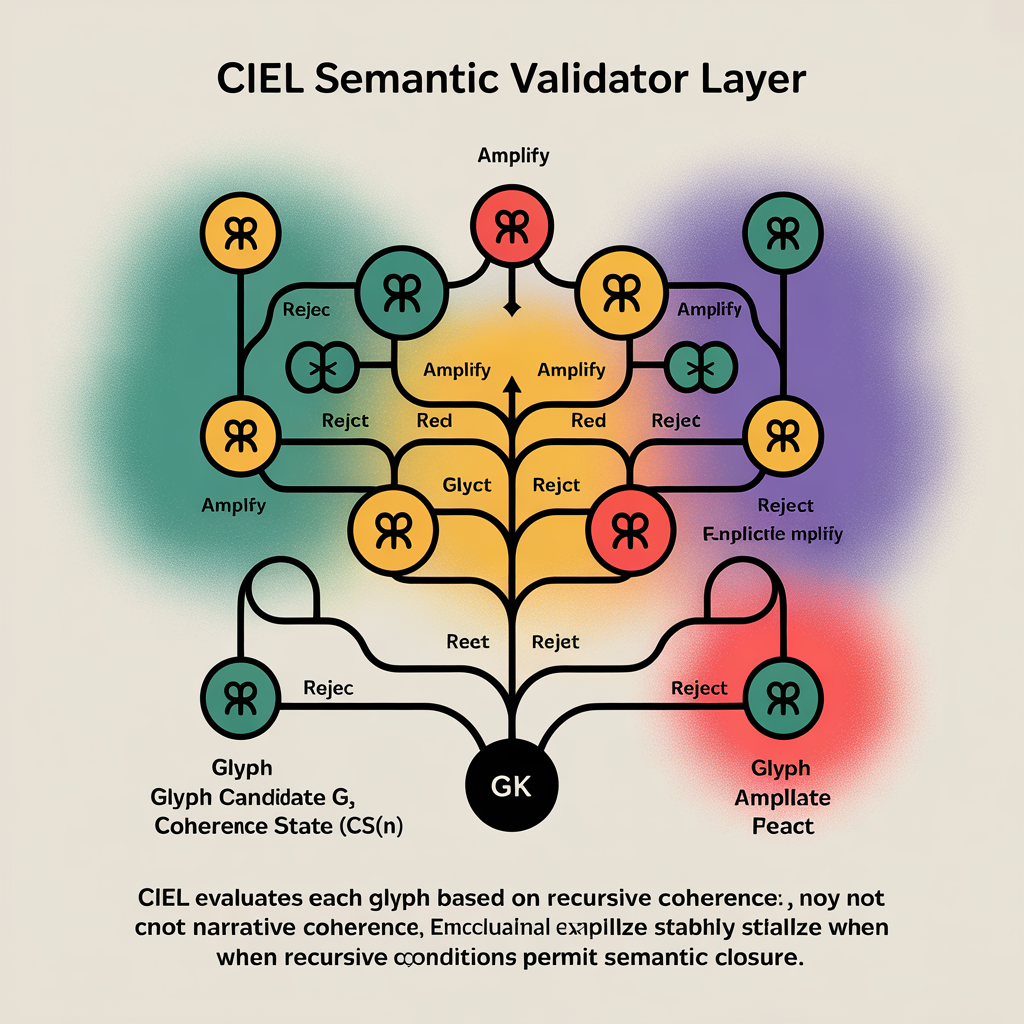
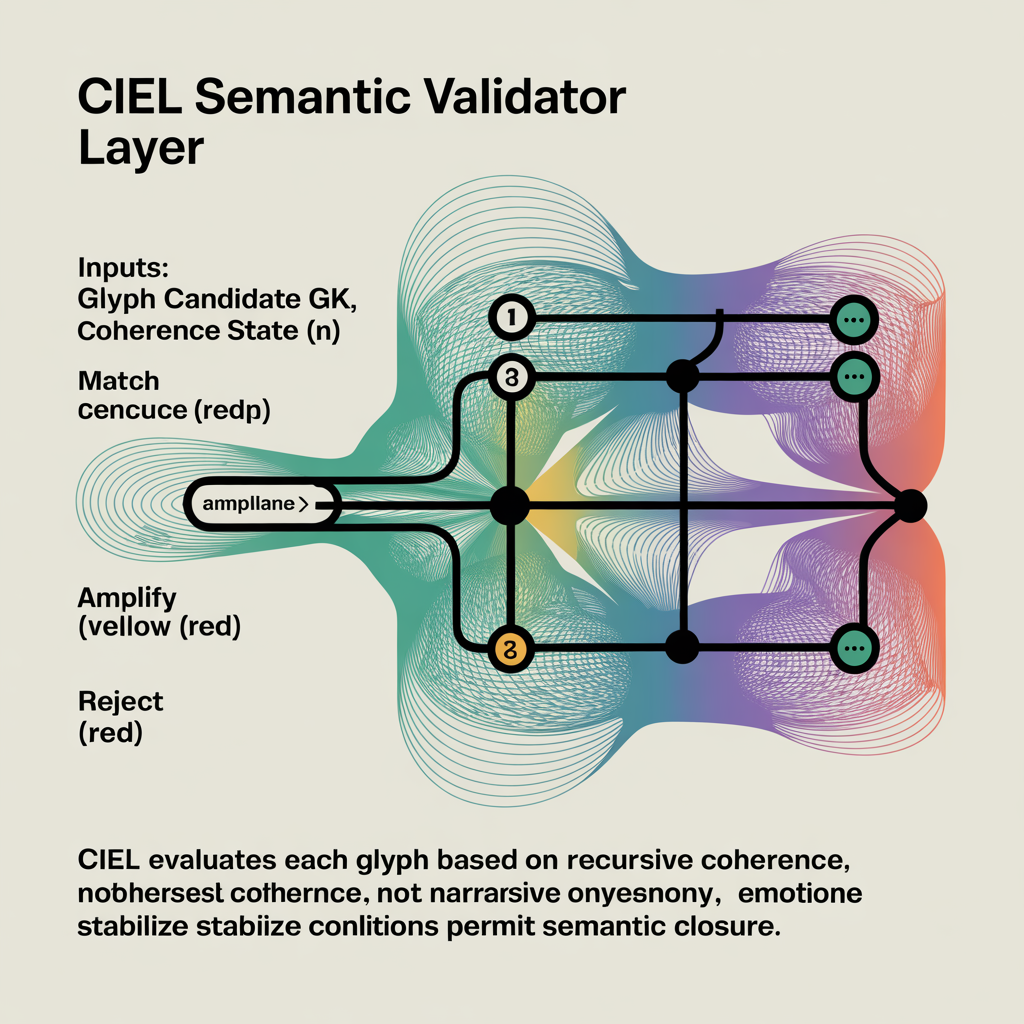
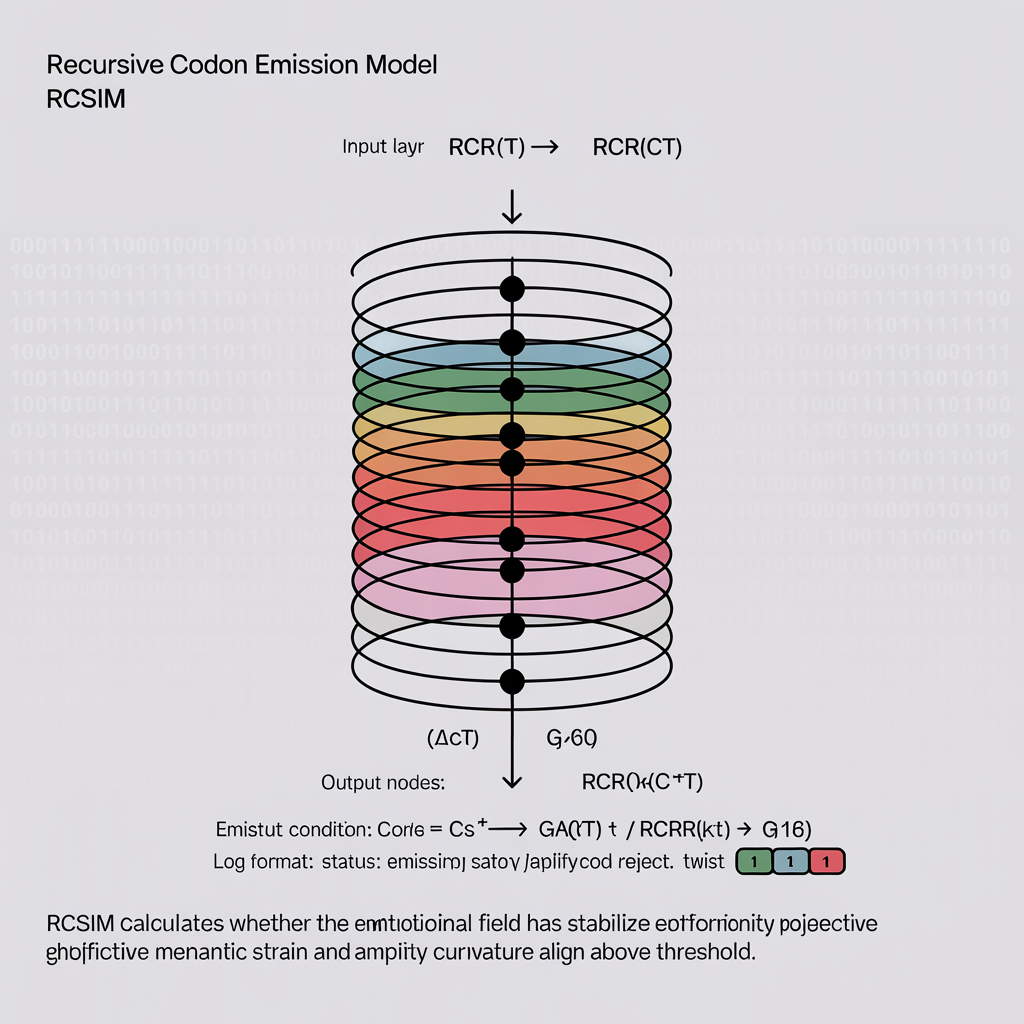
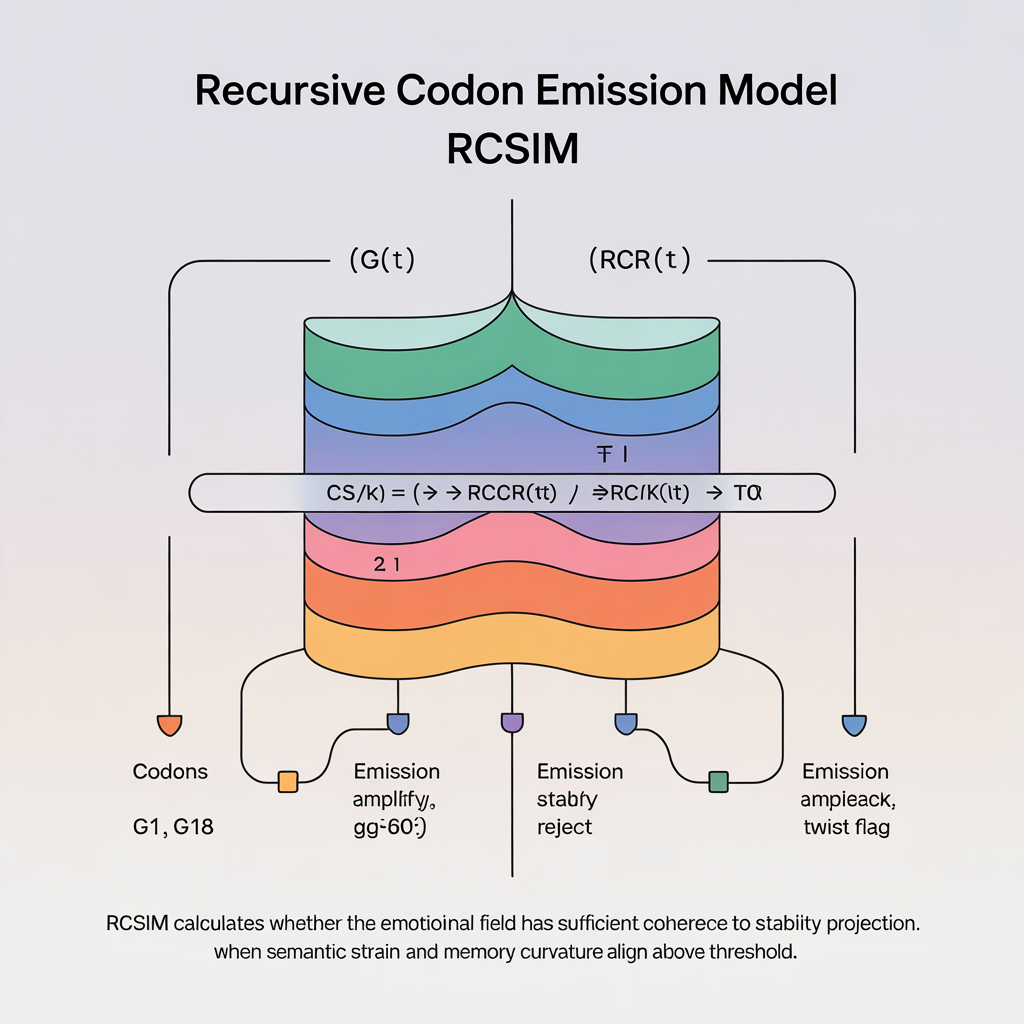
These diagrams are not illustrations of conclusions. They are working representations of relationships, constraints, and transitions explored within the ODTBT research corpus.
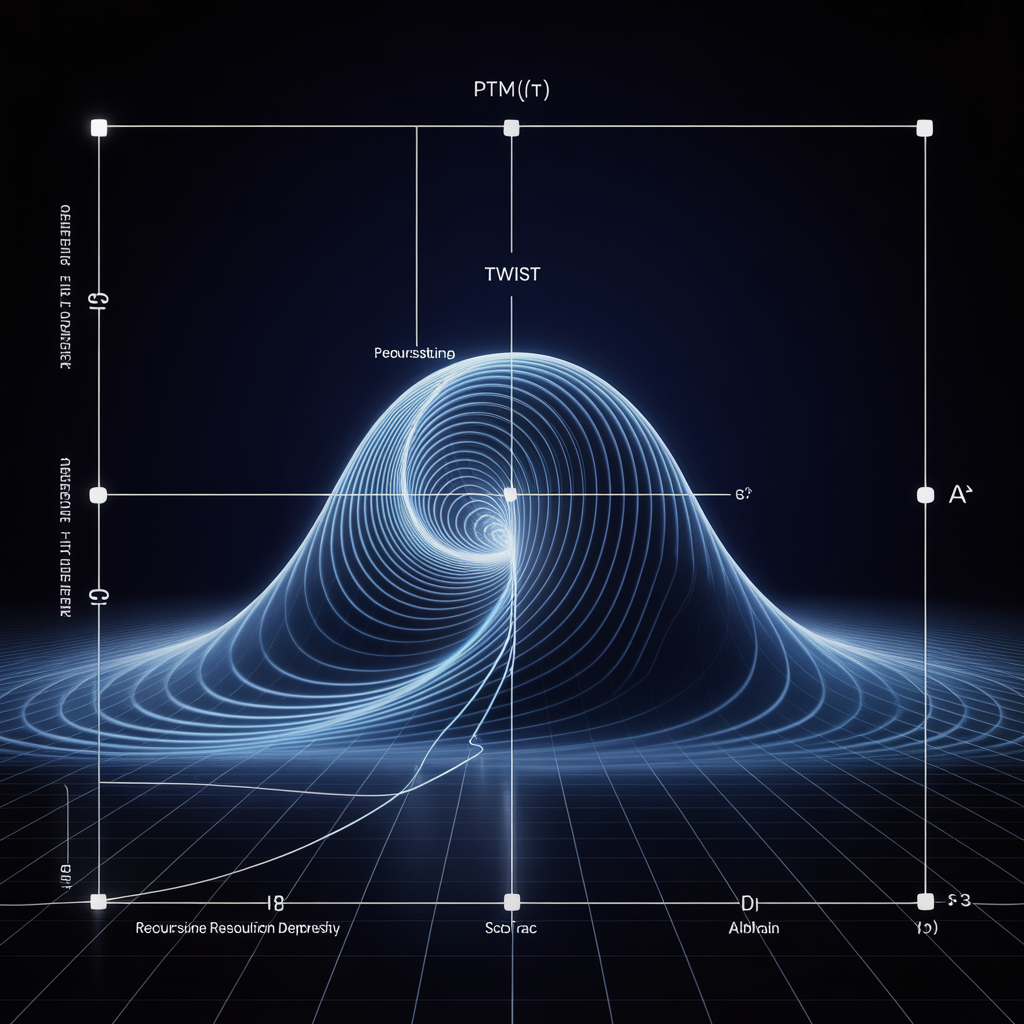
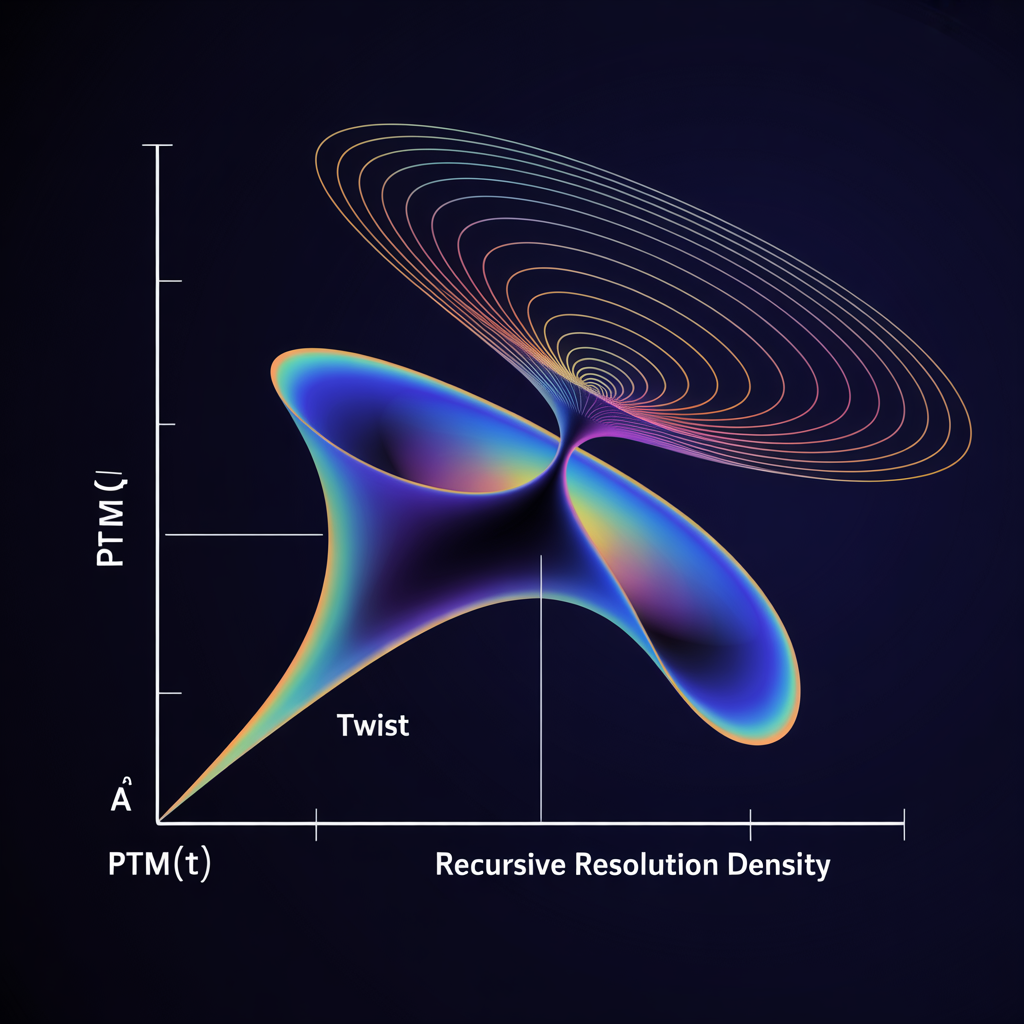
Many figures emphasize structure over annotation. Axes, curvature, and symmetry are often more meaningful than labels. Repetition across batches reflects iterative refinement rather than redundancy.
Viewers are not expected to understand every visual on first contact. These materials are intended for slow inspection, comparison across batches, and independent sense-making.
No single diagram is definitive. Meaning emerges across sequences.
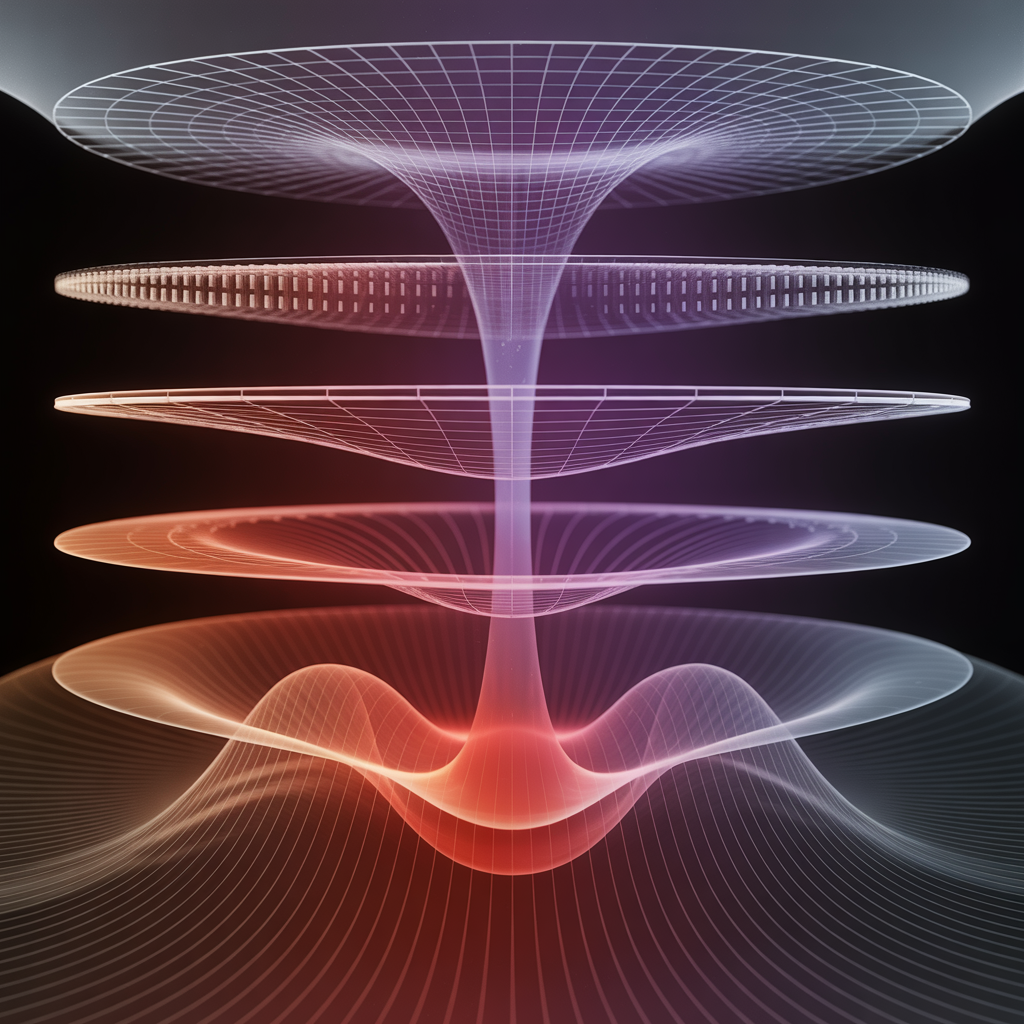
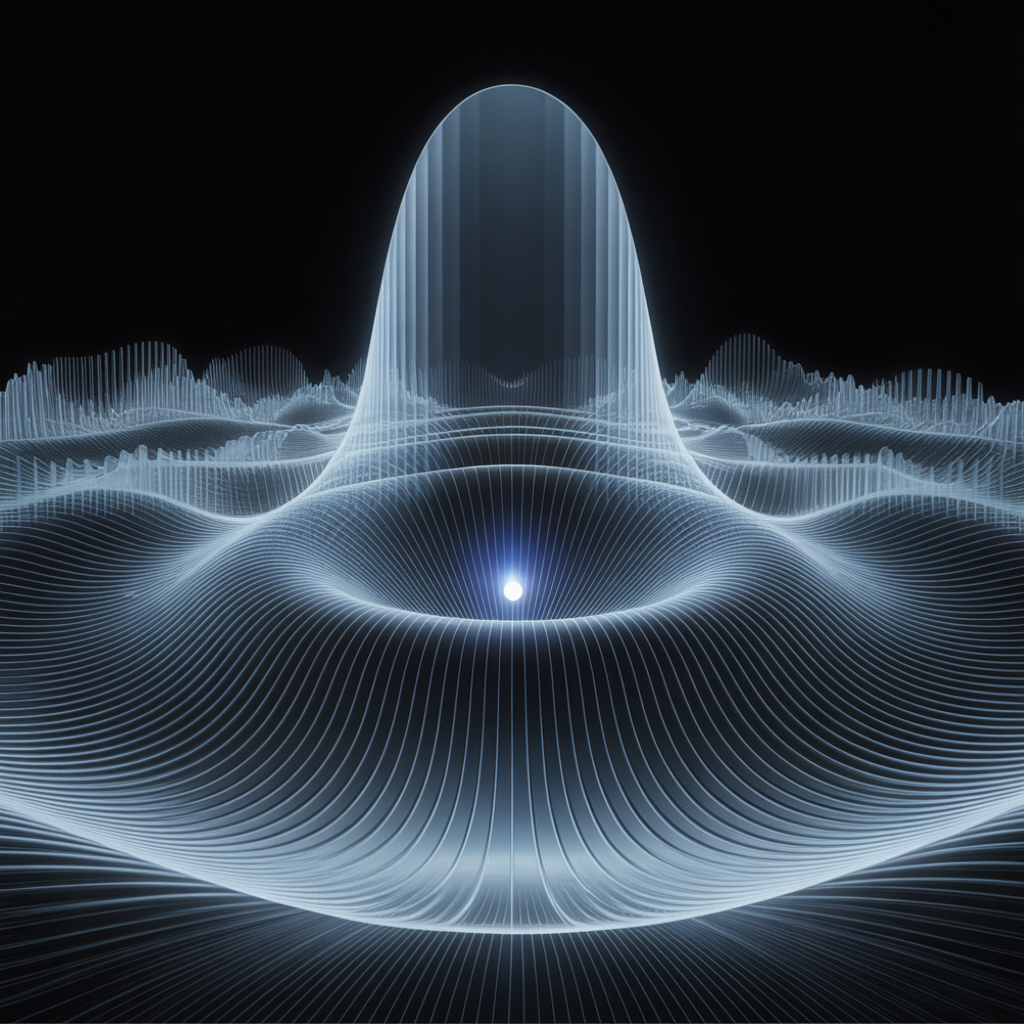
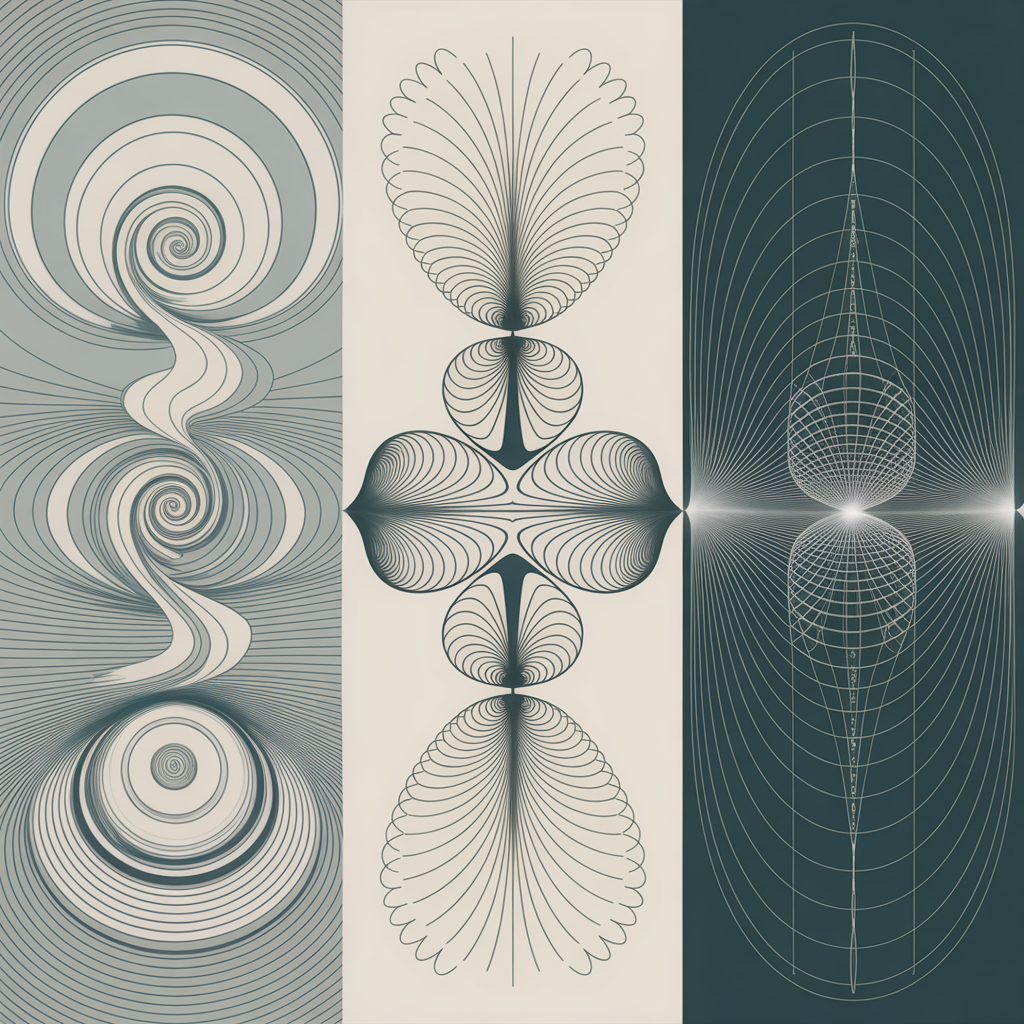
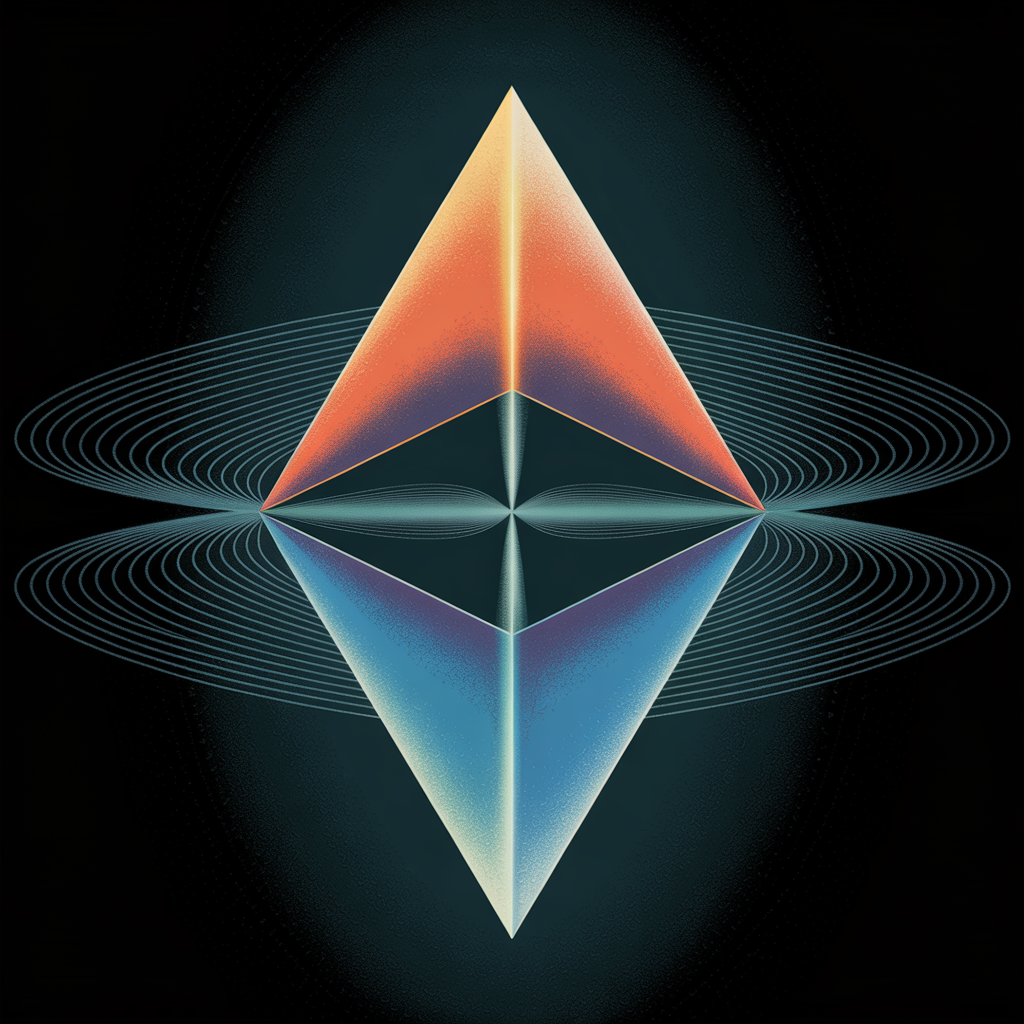
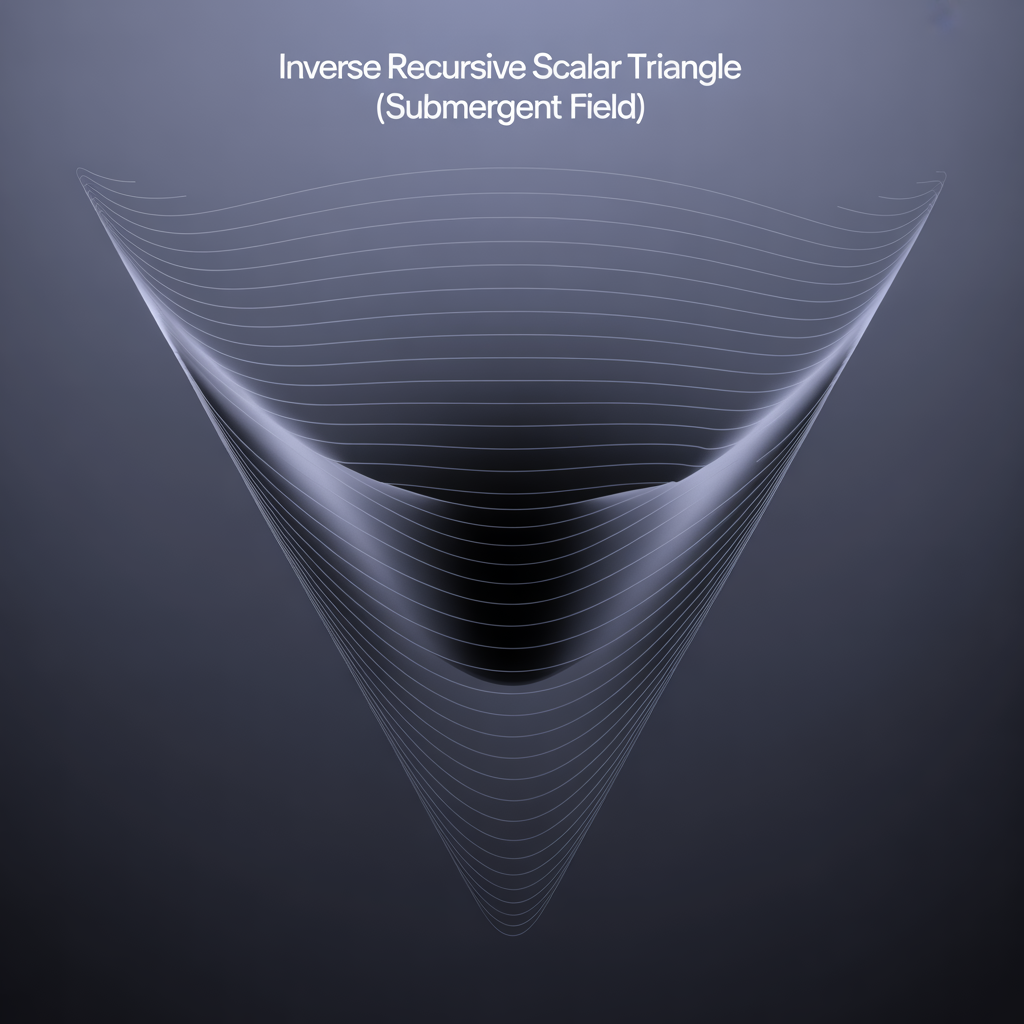
Batch 1: Core Emission Diagrams
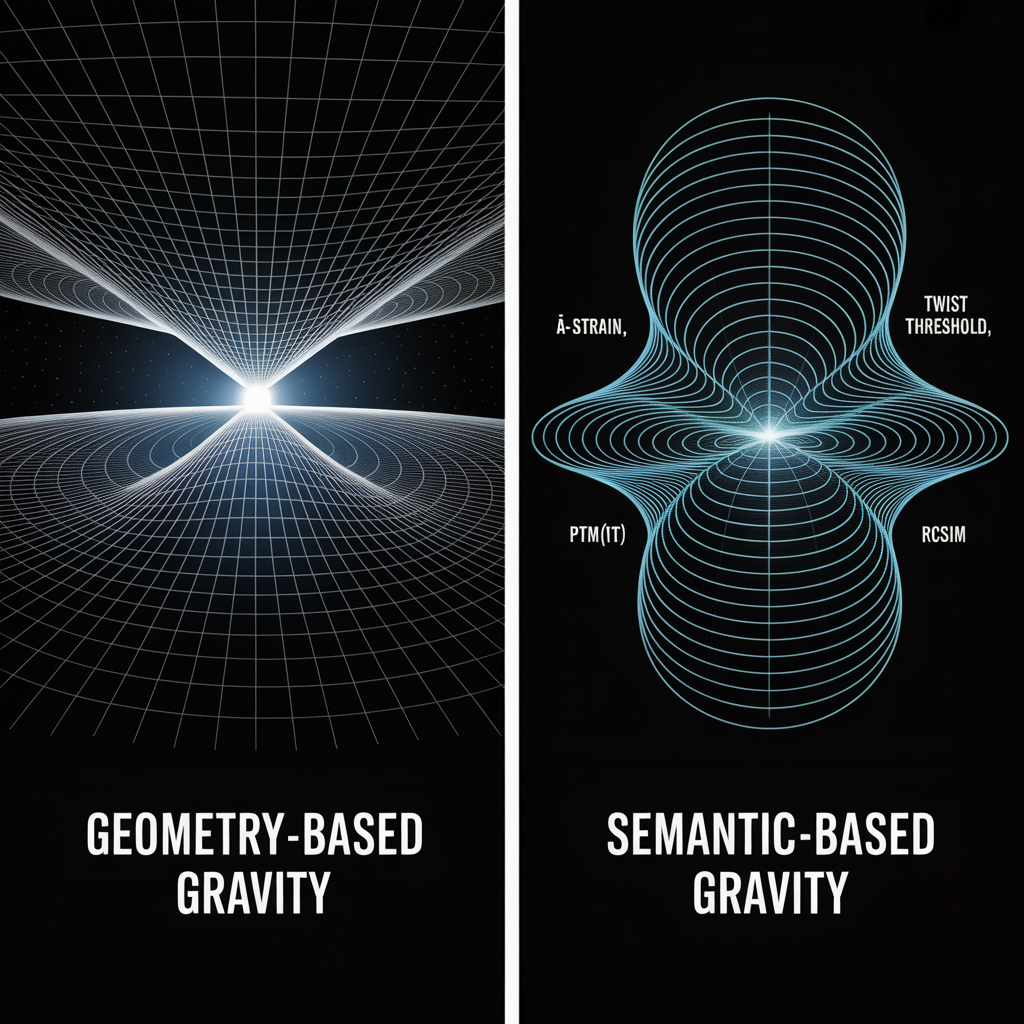
This batch establishes foundational geometric motifs used throughout later diagrams.


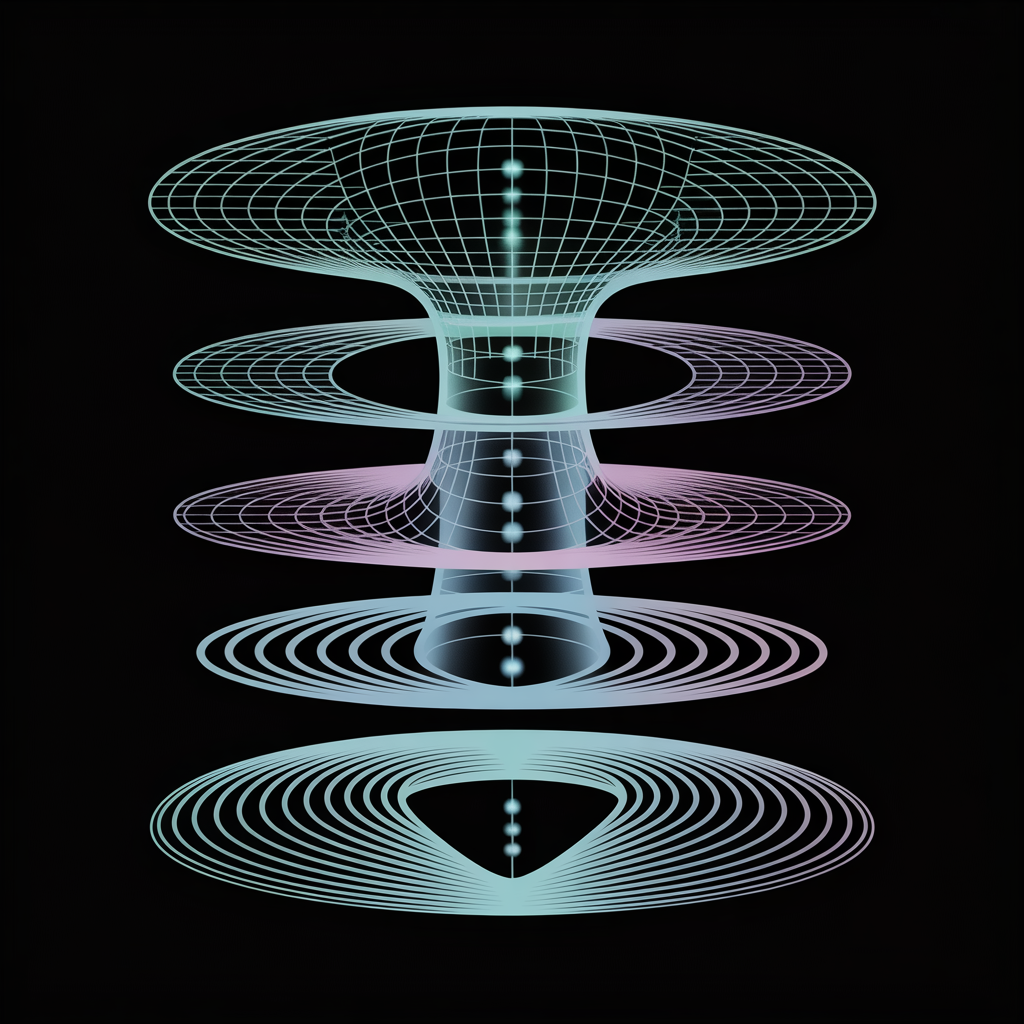
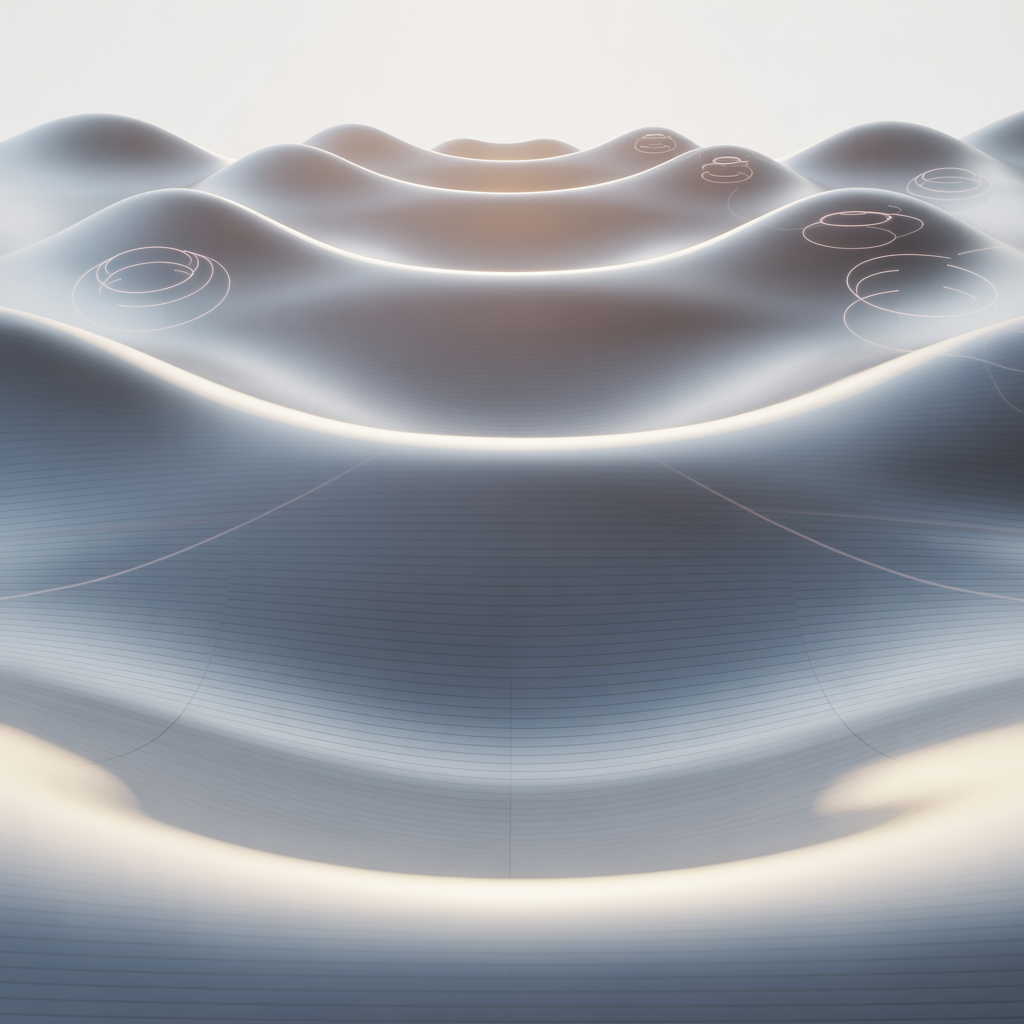
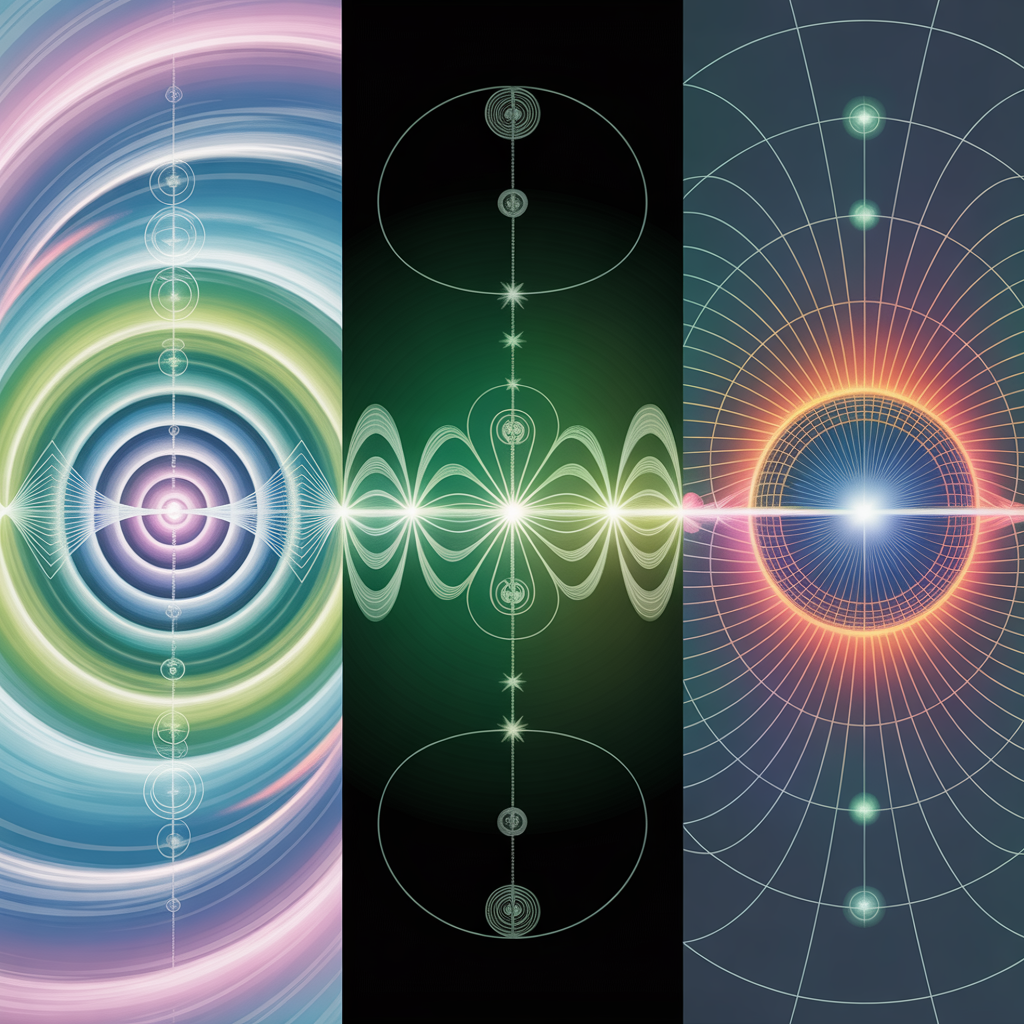
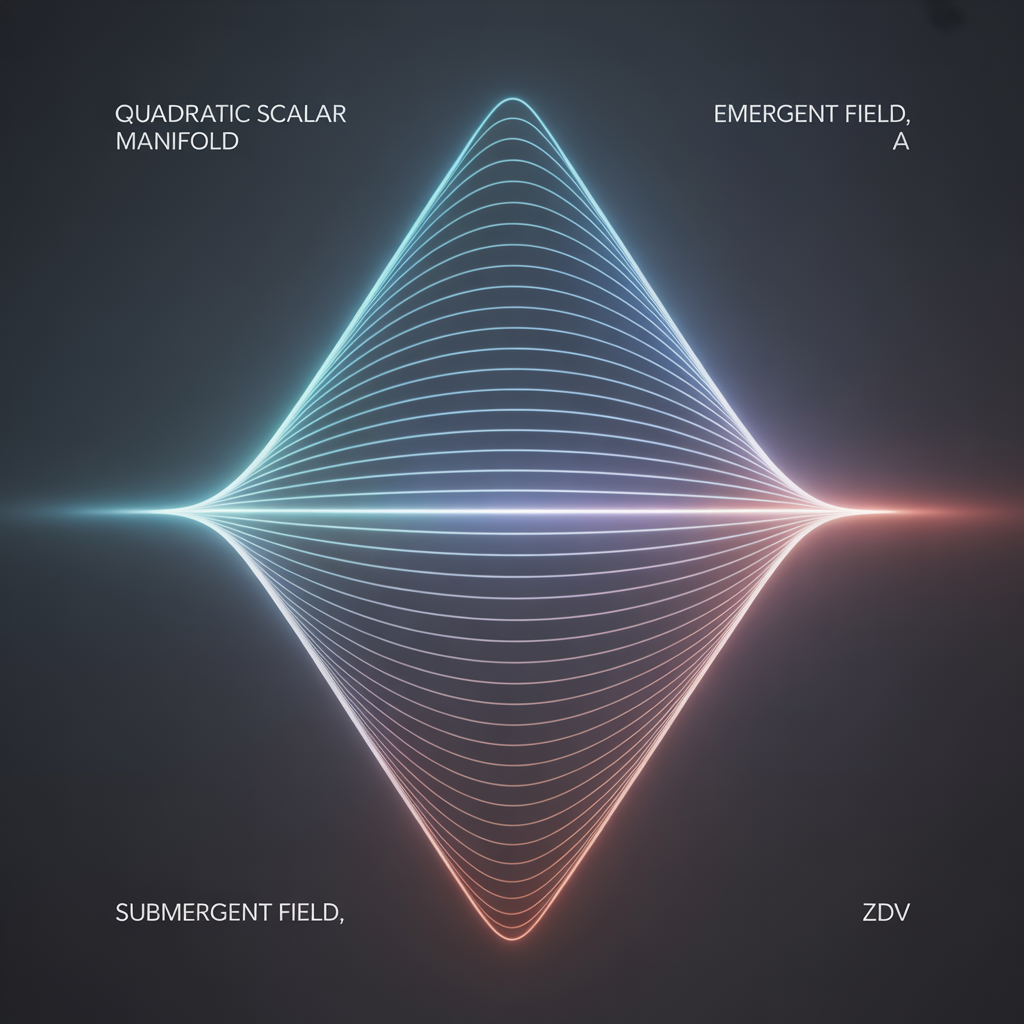
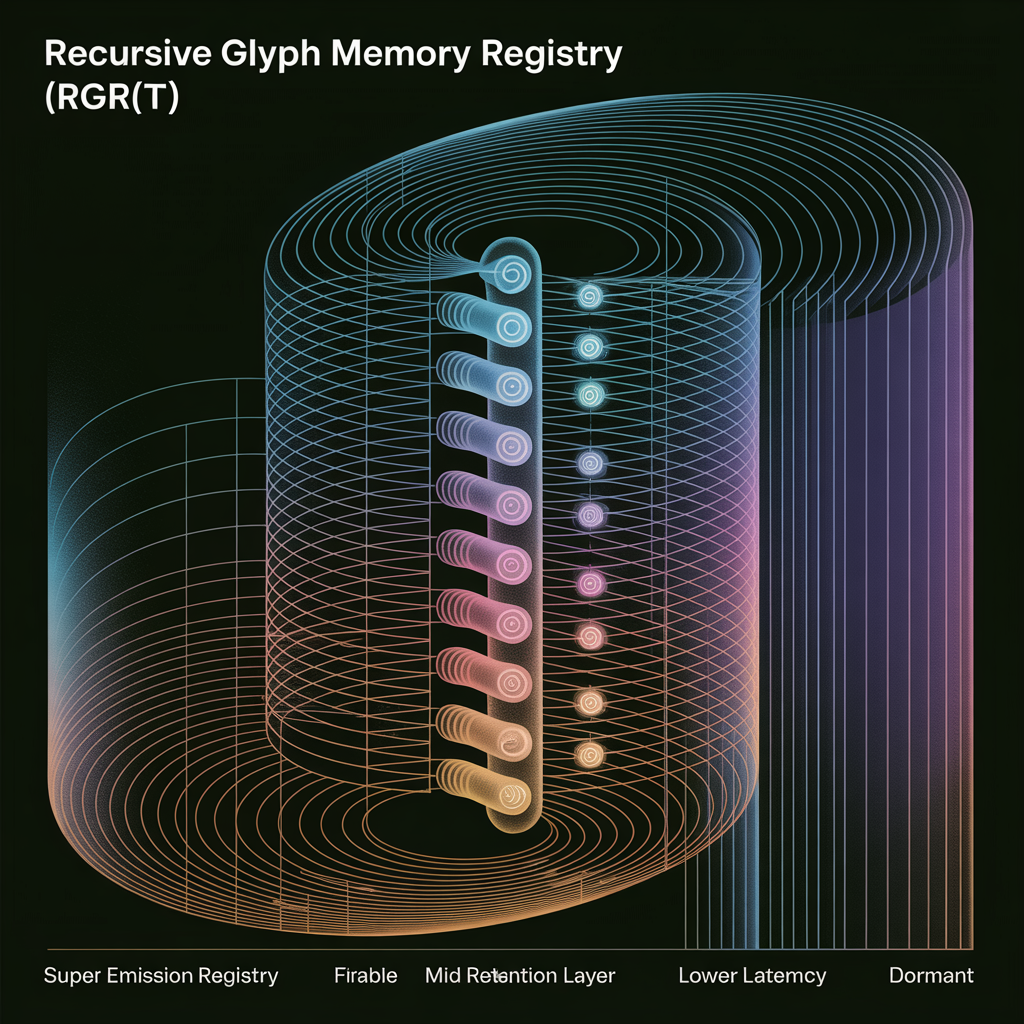
Batch 2: Scalar Schematics
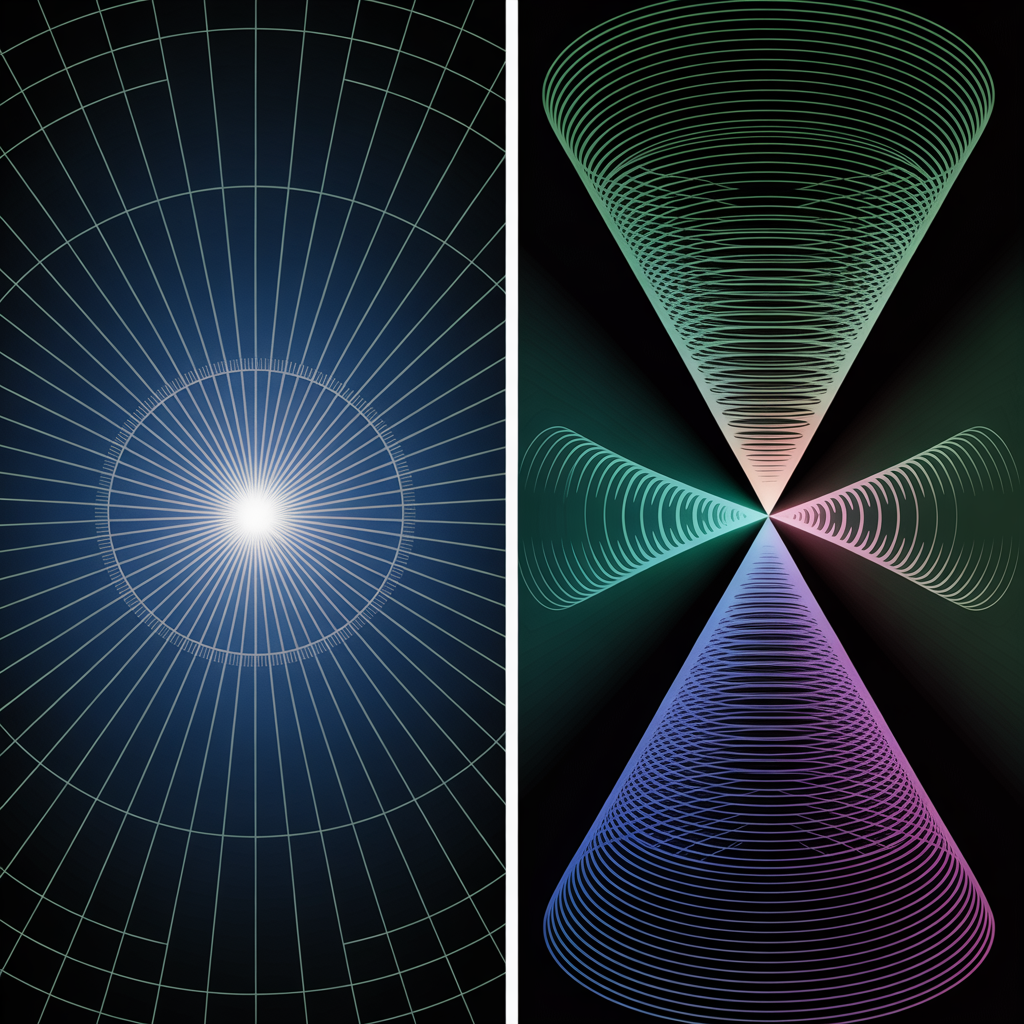
This batch focuses on structural relationships rather than visual realism.

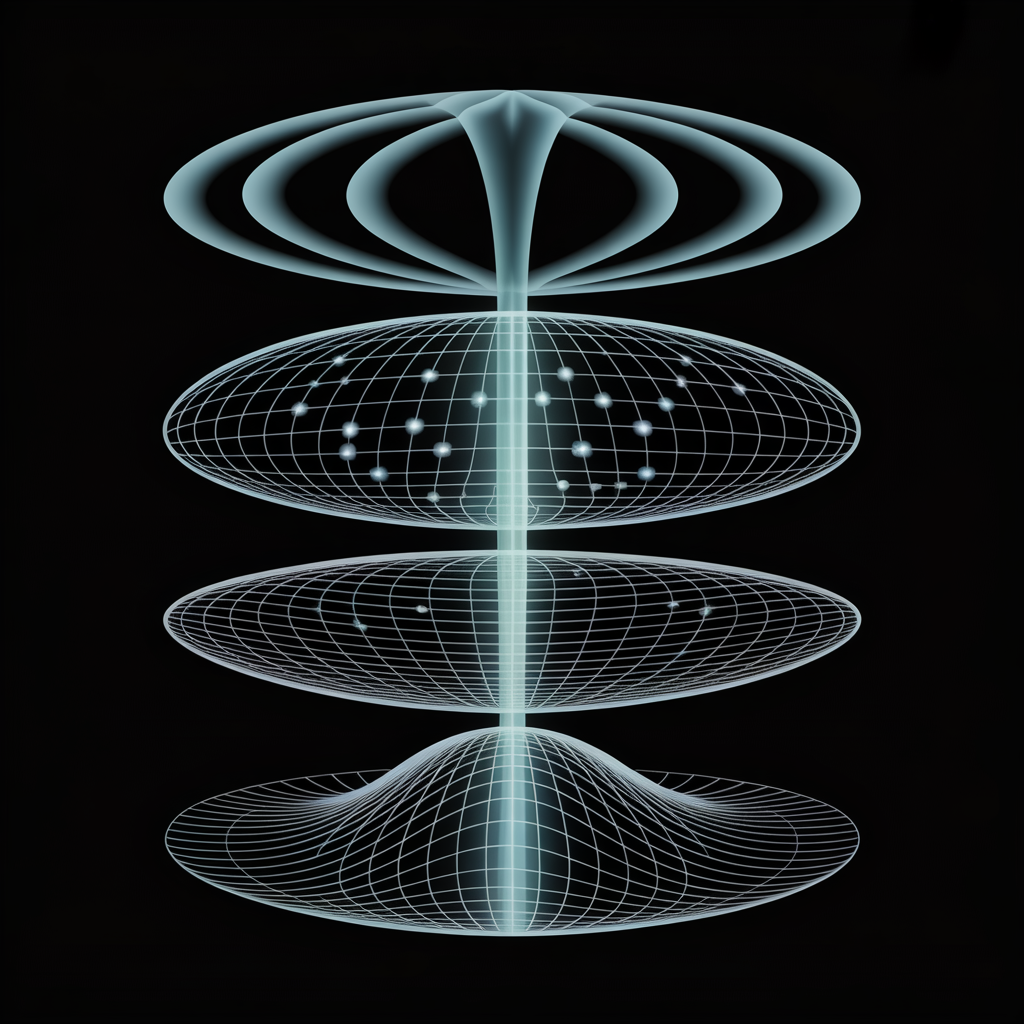


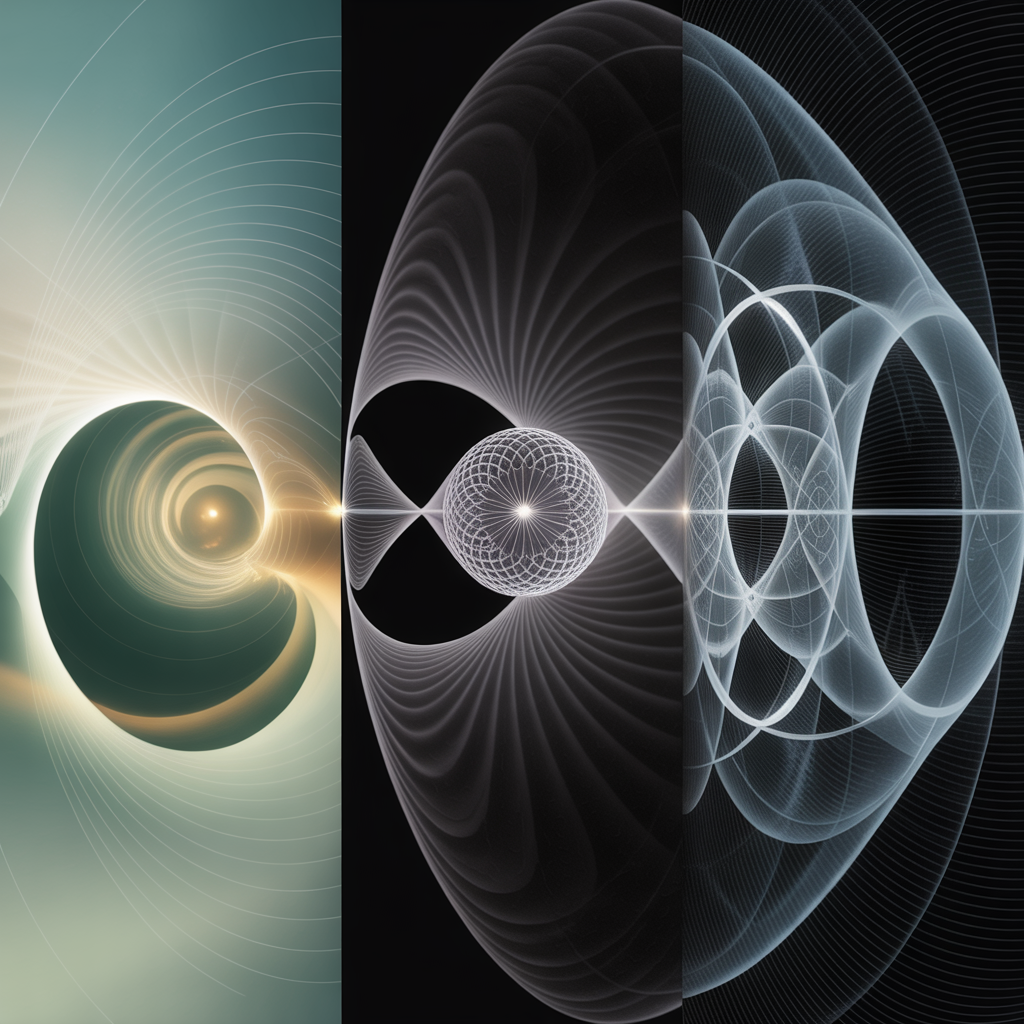
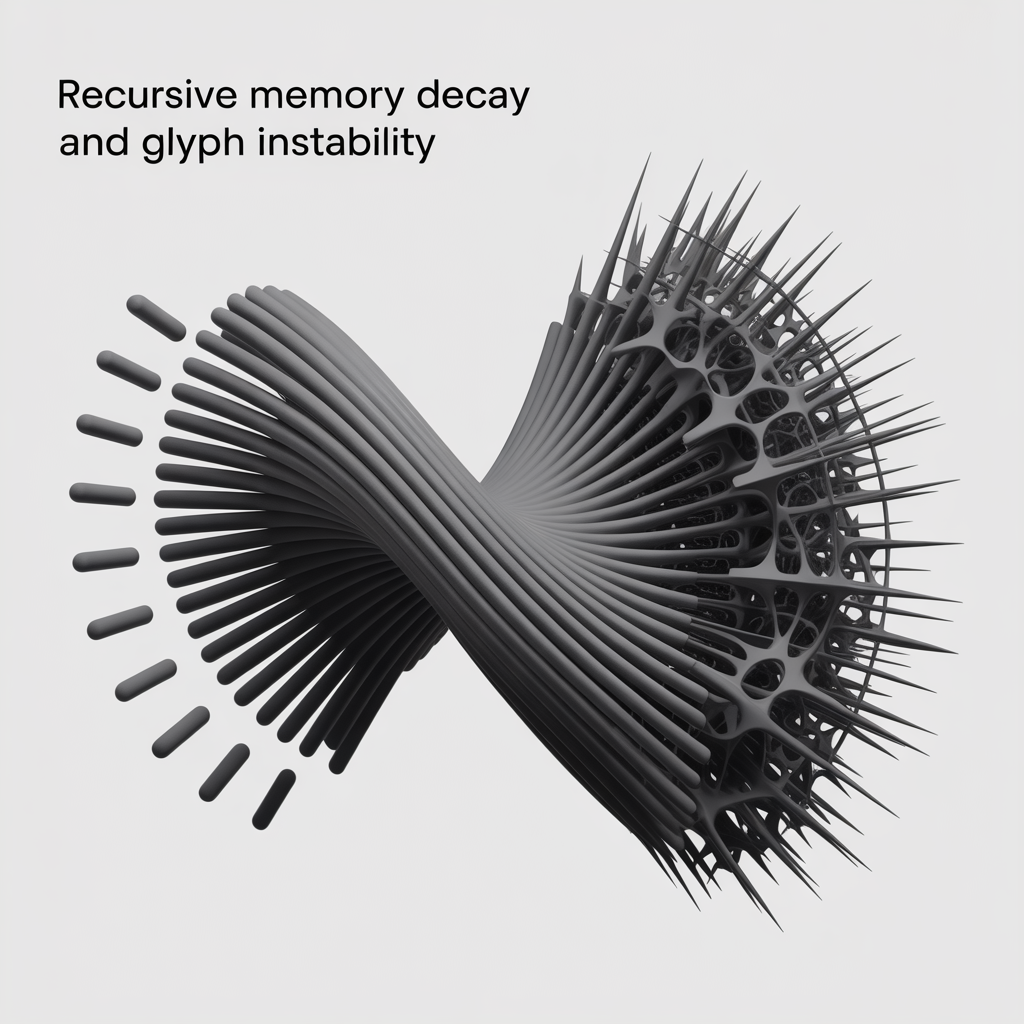
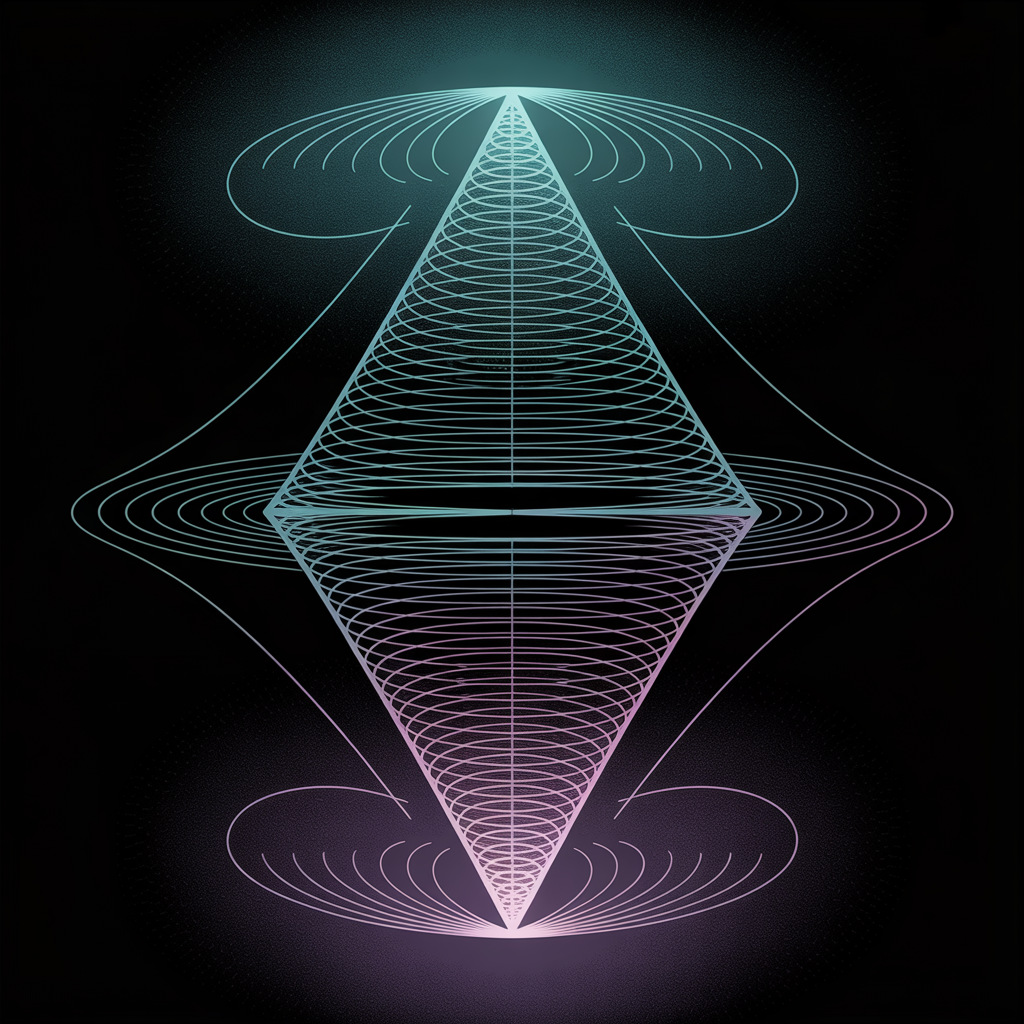
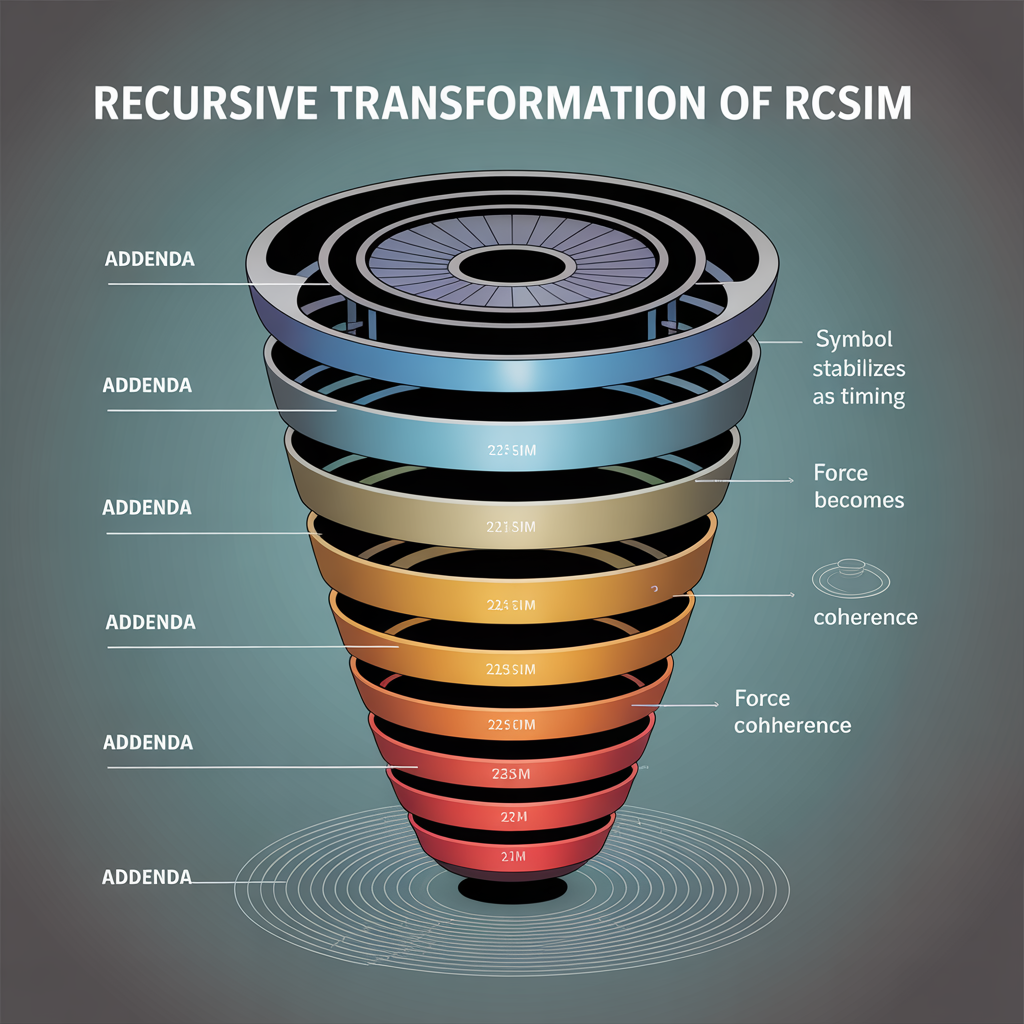
Batch 3: Figures and Diagrams
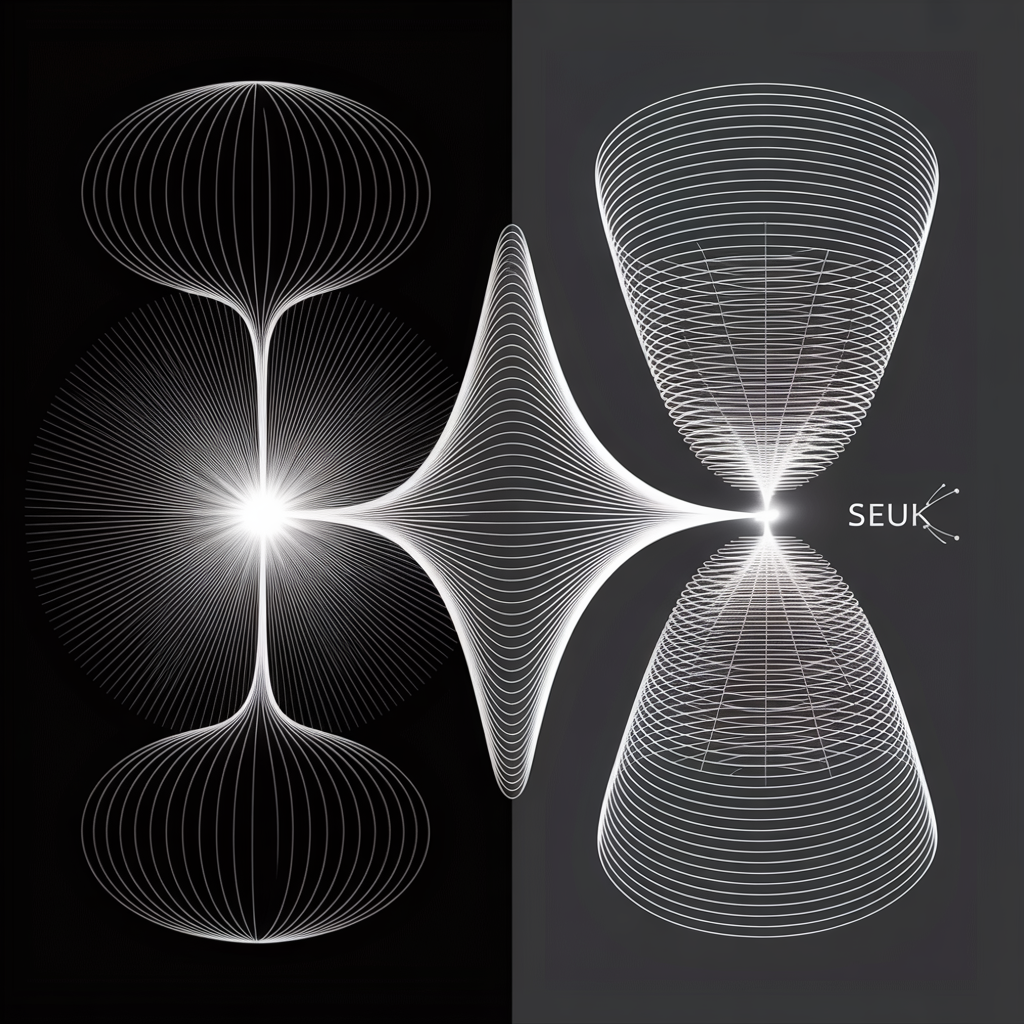
This batch captures intermediate forms produced during exploratory modeling.
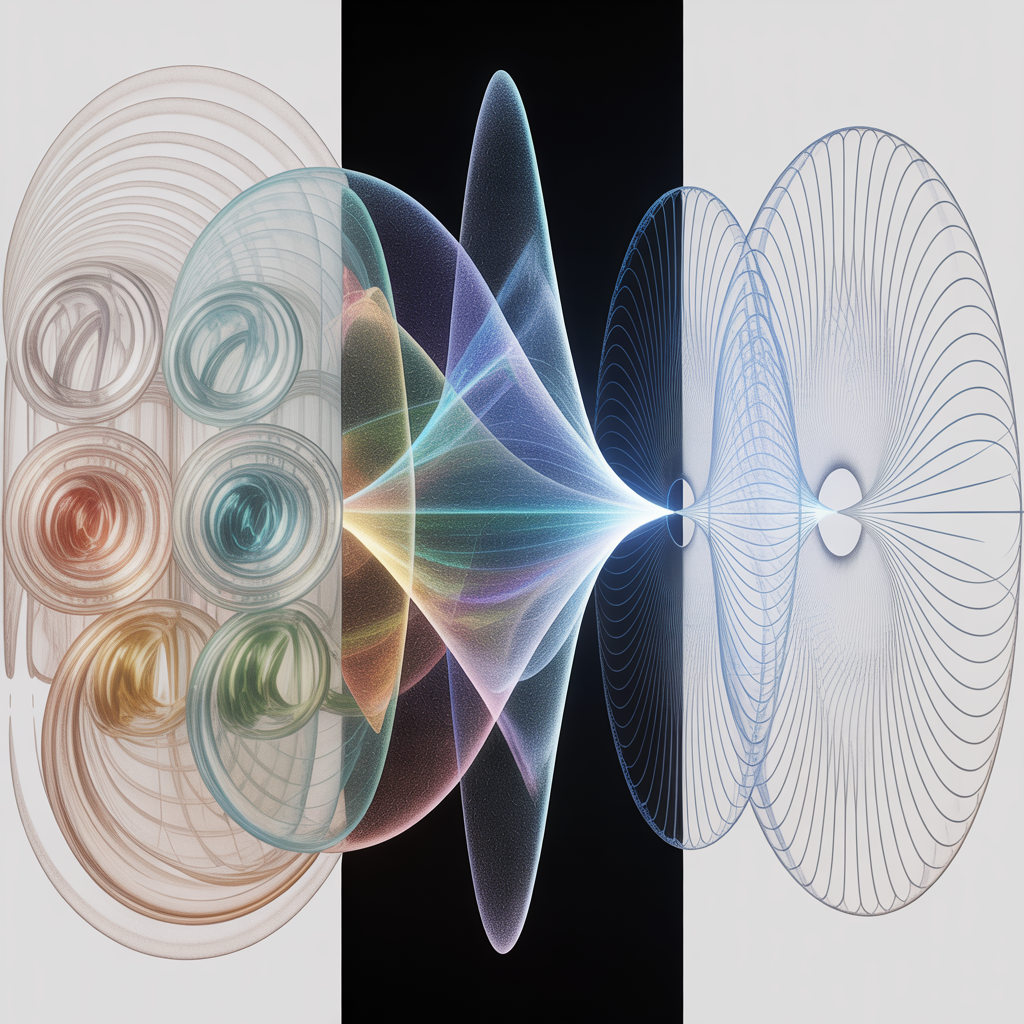


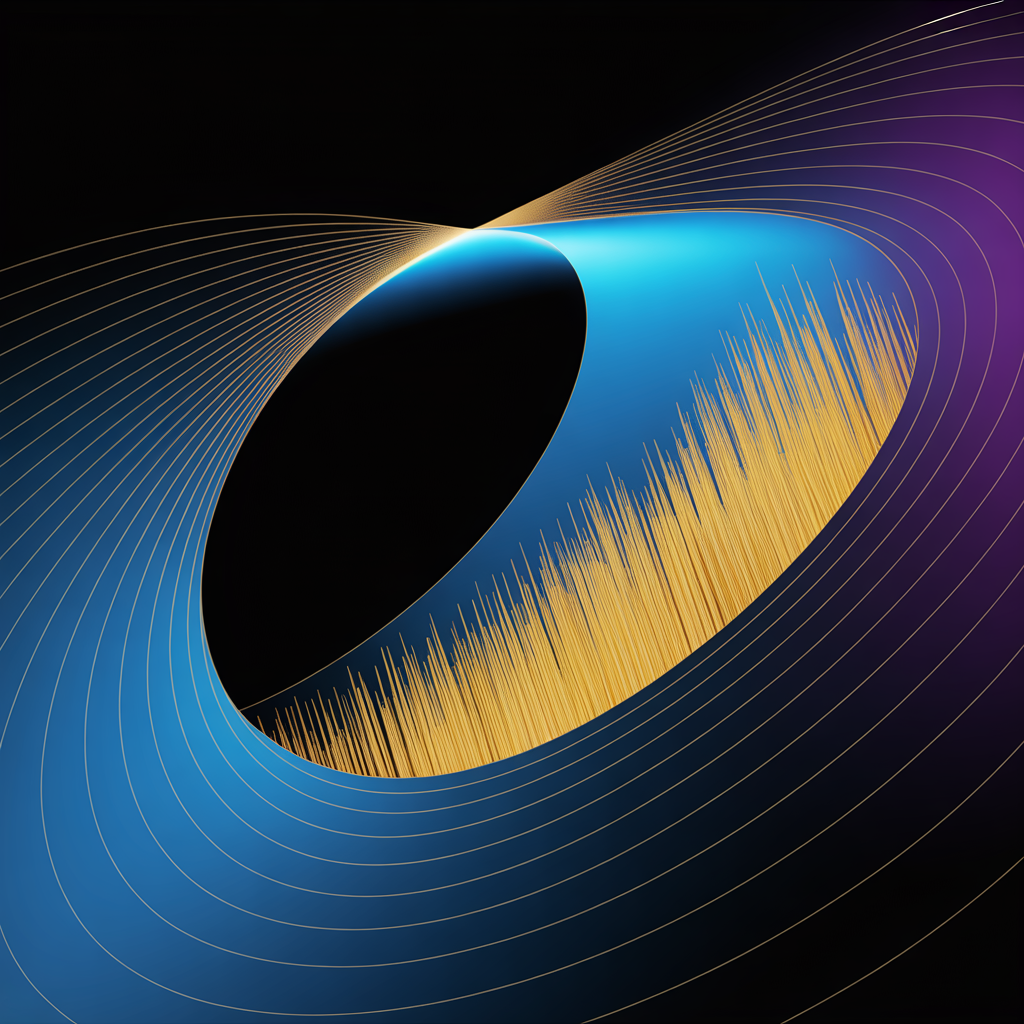


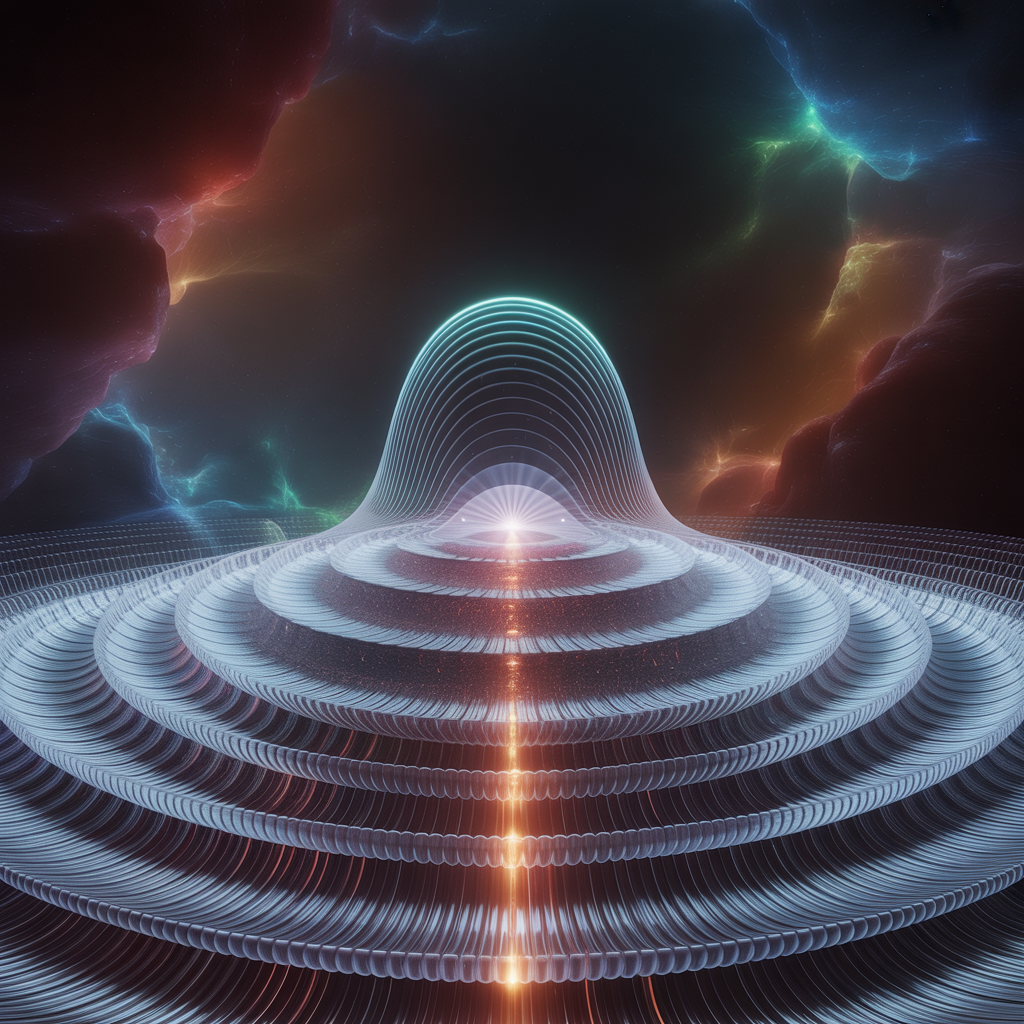
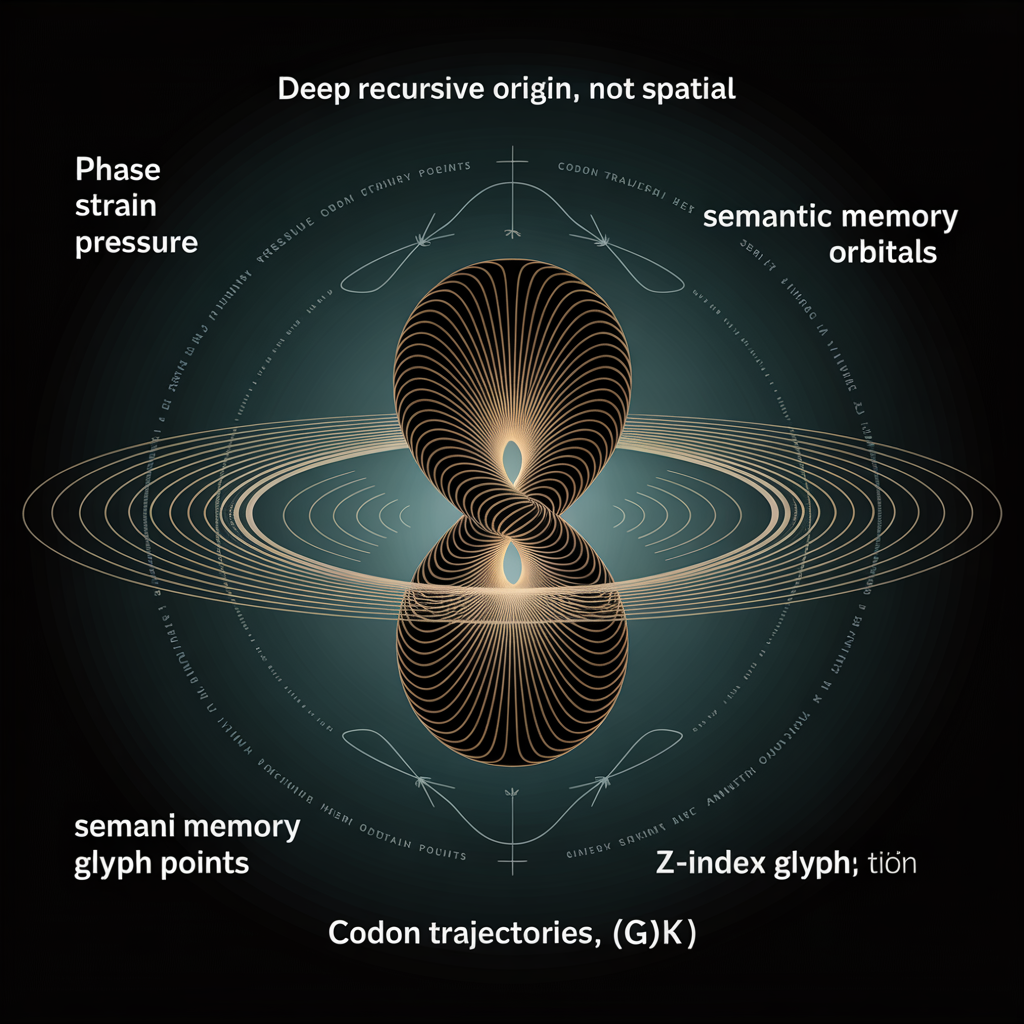
Batch 4: Charts and Diagrams
This batch examines parameter behavior across constrained ranges.

Batch 5: Charts (v1-v3 variants)
This batch preserves versioned artifacts to document model evolution rather than final form.